Biology Reference
In-Depth Information
Industries &
construction
sites
Transport
system
Recreational
activities
Input
Agglomerations
Buffer
zones
(km)
Water
transport
(0.6)
Road
network
(0.8, 0.6,
0.55)
Railway
network
(0.65)
Agglomerations
with more than
1000, 10 000,
inhabitants
(0.5, 1)
Cumulative
effects of
noise
sources
High traffic
intensity &
major
airports
(1.5,0.9)
Recreational
activities
(0.7)
Analysis
Local &
major
industries
(0.5, 1.1)
Construction
sites
(1)
Spatial
overlay
Proposed
QAs of
Greece (with
land use
types)
excluding
QAs < 10 km
2
Potential
QAs of
Greece
NAs of
Greece
extraction
Output
Proposed QAs
of Greece (with
altitudinal
classes)
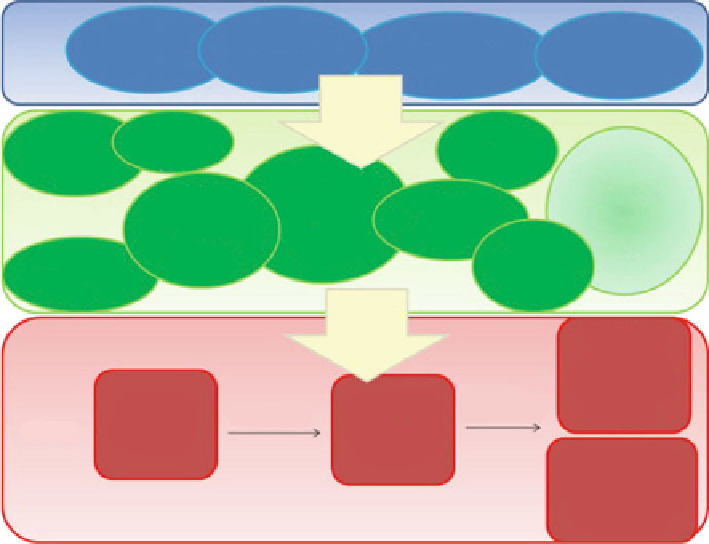
Fig. 10.3
GIS processing of noise sources across Greece to calculate the Quiet Areas
(Reproduced with permission from Votsi et al. 2012)
on instrumental recording of the sound pressure, but depicting a soundscape
requires a more integrated approach not easily transferred into visual maps.
The assessment of quiet areas at a country scale is important for future planning
and management of natural resources. Votsi et al. (
2012
) (Fig.
10.3
), according to
the EU's Environmental Noise Directive (END, 2002/49/EC), reported a map of
Quiet Areas in open country areas of Greece using a distance-based criteria where
the quiet areas (QAs) were calculated as distance from noise sources (the categories
considered were road traffic, railway noise, residential areas, industrial noise,
aircraft noise, ports, construction sites, recreational activities). This approach is
less accurate than the direct noise measurement but the results are useful to locate
the critical areas in which to collect true noise data in further investigation.
10.6 Valuing Noises in Recreation Areas
Recreation noise is becoming an important issue in many national parks and natural
areas and poses management problems. In particular in accessible front-country
areas the concentration of loud people in some periods of the year can create
problems for the natural quiet.
Search WWH ::

Custom Search