Biology Reference
In-Depth Information
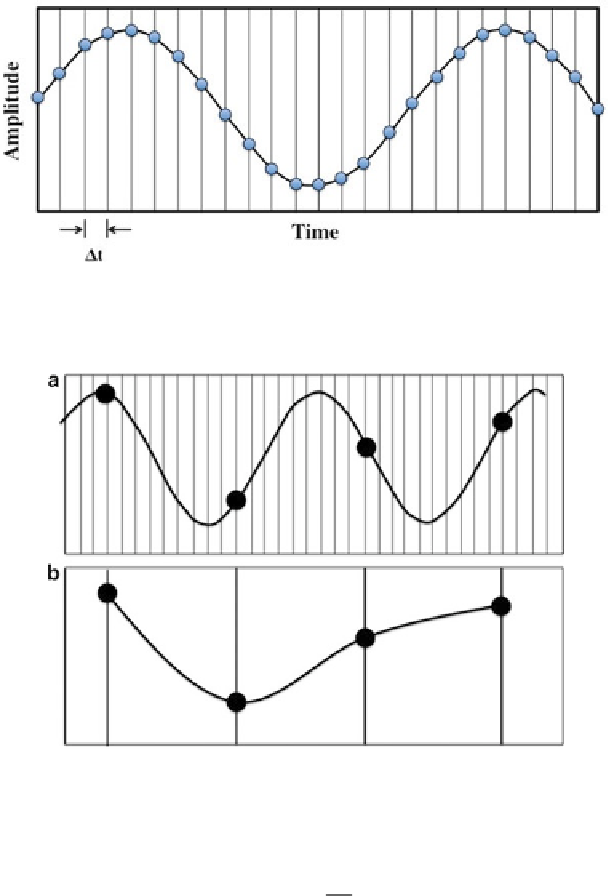
Fig. 9.6
A sinusoidal curve that represents the continuous analog waveform sampled at a
Δt
interval: every sampled point represents the digital conversion of the signal
Fig. 9.7
Aliasing is the result of a poor sample rate of a sinusoidal curve (
a
). (
b
) The reconstruc-
tion of a digitalized curve that is not correspondent with the original analog curve. In this scheme
the sampling in (
b
) has to be nine times larger (in Hz) than the original
SR
2
f
max
¼
where:
f
max
¼
Nyquist limit frequency (Hz)
SR
¼
sampling rate (samples/s)
So if the digital sampling rate (SR) is 44.1 kHz, the signal is digitized to the
frequency of 22.05 kHz.
The precision at which the analog instantaneous amplitude is converted into a
digital format depends on the sample size or number of bits (bit depth) utilized in
Search WWH ::

Custom Search