Biology Reference
In-Depth Information
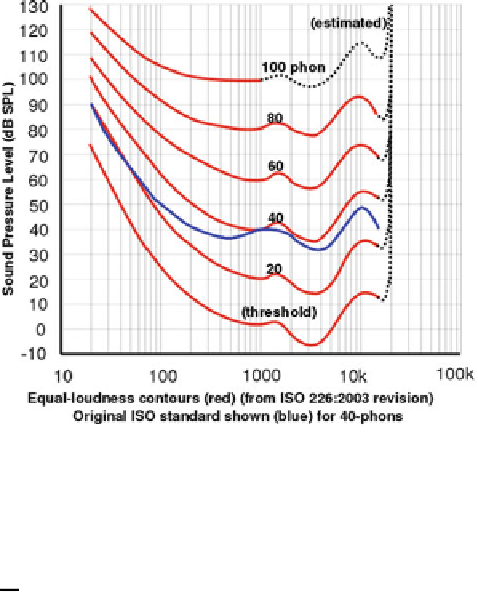
Fig. 9.4
The isophonic
curves of human audibility
according to dB and
frequencies: the system
appears not linear and is
strongly influenced by age
class and individual
auditive capacity (From
ISO 226:2003)
variation of voltage of a transducer, and this voltage is proportional to the change of
sound pressure
P
. The power carried by a pressure wave is proportional to the
square amplitude, and the formula becomes
2
¼
10log
P
2
10log
I
2
P
2
P
1
P
2
P
1
Δ
I
dB
ðÞ¼
I
1
¼
P
1
¼
10log
20log
The factor of 2 is added to the equation because the logarithm of the square of a
quantity is equal to twice the logarithm of that quantity.
Considering that a microphone or a transducer converts the acoustic pressure
into voltage, the formula can be rewritten:
20 log
V
2
V
1
Δ
I
dB
ðÞ¼
In acoustics is quite hard to measure the sound in terms of power (W, watt),
intensity (W/m
2
), and acoustic pressure (Pa, pascal) because the variation between
the lowest and the highest value create difficulties for understanding the phenome-
non. In fact, the acoustic pressure for humans varies between 20
μ
Pa and 63.2 Pa,
which is the limit for the pain threshold in humans with variation of 10
6
. In Fig.
9.4
are reported the isophonic curves that represent the level of audibility by humans
according to dB and frequencies. The system appears not linear and is strongly
influenced by age class and individual auditory capacity.
The logarithmic scale is more convenient because sound magnitude has a range
that can be of eight orders of magnitude (in submarine condition) and the human
internal ear system works in acoustic perception similarly to a logarithmic scale.


Search WWH ::

Custom Search