Environmental Engineering Reference
In-Depth Information
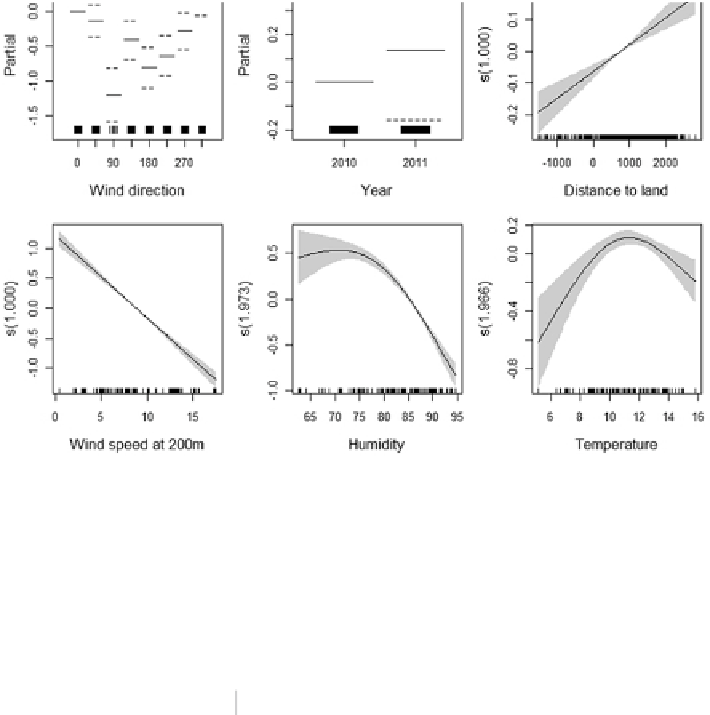
Fig. 8
Response curves of the GAMM for the red kite at Rødsand 2 displaying the relationship
between the flight altitude and predictor variables. The values of the environmental predictors are
shown on the X-axis and the probability on the Y-axis in logit scale. The degree of smoothing is
indicated in the title of the Y-axis. The
shaded areas
and the
dotted lines
show the 95 % Bayesian
confidence intervals
Table 5
Significance and t- and F-values for the fixed parametric (wind directions and survey year)
and smooth terms included in the GAMM for the red kite
t-value
p-value
Parametric
Direction 45°
−1.274
0.20
Direction 90°
−6.226
<0.01
Direction 135°
−3.035
<0.01
Direction 180°
−5.709
<0.01
Direction 225°
−4.391
<0.01
Direction 270°
−2.188
0.03
Direction 315°
1.528
0.13
Year 2011
0.910
0.36
Smooth
F-value
p-value
Dist. to land
33.05
<0.01
Wind speed
315.74
<0.01
Humidity
101.93
<0.01
Temperature
13.21
<0.01
R-sq. (adj) 0.41
Spearman's Rho 0.68
Sample size 1,313
The model was evaluated by fitting the model on 70 % and testing the predictive accuracy on 30 %
by estimating Spearman's rank correlation coefficient (Rho) between observed and predicted
altitudes. Adjusted R
2
value is given as an indication of variance explained by the model