Graphics Reference
In-Depth Information
are semitransparent colours, line joins and endings (Fig.
.
) and full access to a va-
riety of fonts. Edward Tute has recommended (Tute,
) the use of professional
graphics sotware such as Adobe Illustrator toachieve quality results, but even better
is the ability to provide the control within the statistical graphics sotware itself.
In R there is a large set of graphical parameters that allow control over many as-
pects of graphical output, such as colours, line types and fonts (see the previous ex-
ample code demonstrating the control of colour, line type and line width), but this
could be extended further to include any of the basic drawing parameters and oper-
ators that you will find in a sophisticated graphics language such as SVG. Examples
are gradient fills (where a region is filled with a smoothly varying colour), general
pattern fills and composition of output.
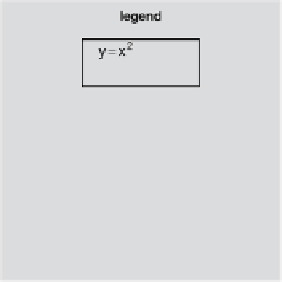
Anexampleoftheuseofcompositionoperatorsistheadditionofalegendtoaplot,
both of which have a transparent background, but where the plot has grid lines. If we
do not want the grid lines to appear in the legend background, one way to achieve
Figure
.
.
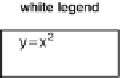
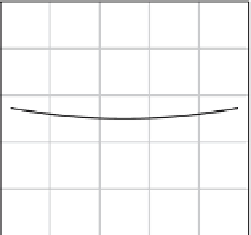
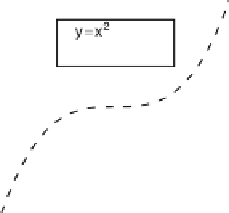
Composing graphical elements on a white background. here are three elements being
composed: two legends, one with a transparent background and one with a white background (top let),
and a plot with a transparent background (top right). In the bottom let, the legend with a transparent
background is drawn over the plot and the grid lines in the plot are visible behind the legend. In the
bottom right, the legend with a white background is drawn over the plot and the grid lines in the plot are
not visible behind the legend