Graphics Reference
In-Depth Information
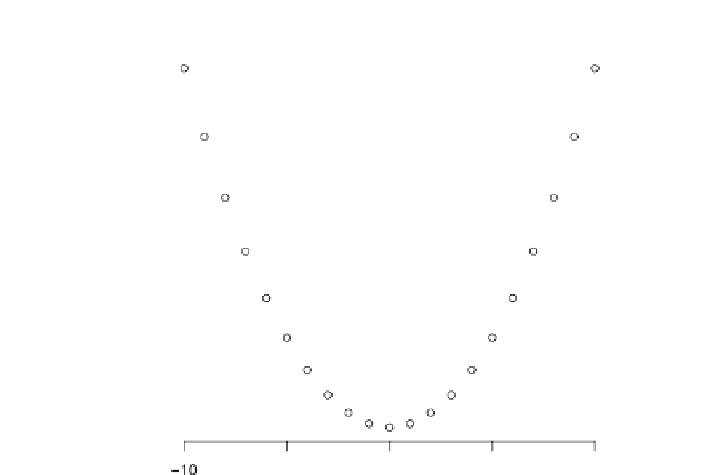
Figure
.
.
A basic scatterplot consisting of axes, labels and data symbols
lines and rectangles (though he may also want to do that; see Sect.
.
.
). he user
wants to be able to create an entire plot. To be even more explicit, the user wants to
be able to draw an entire plot with a single command (or via a single menu selection).
his is so far quite uncontroversial, and all statistical sotware packages provide
this feature in one way or another (though they may differ in terms of the range of
different sorts of plots that can be produced). In R, the following command usually
does the trick (where the variable
somedata
contains the data values to plot).
> plot(somedata)
Sensible Defaults
3.1.1
Take another look at the basic plot in Fig.
.
. As we have mentioned, it consists of
a standard set of components: axes, labels and data symbols. But there are other im-
portant aspectstothisplot.Forastart,these components areallinsensible locations;
the title is at the top and, very importantly, the data symbols are at the correct loca-
tions relative to the axes (and the scales on the axes ensure that there is su
cient
room for all of the data points).
Some of these aspects are inevitable; no one would use a program that drew data
symbols in the wrong locations or created axis scales so that none of the data could
be seen. However, there are many aspects that are less obvious.