Graphics Reference
In-Depth Information
Figure
.
.
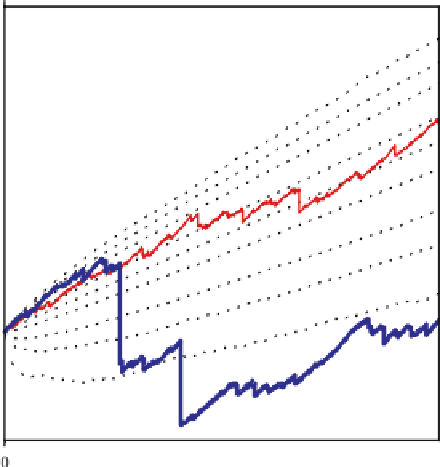
he PCS data simulation results for a homogeneous Poisson process with log-normal
claim sizes (top panel) and a renewal process with Pareto claim sizes and log-normal waiting times
(bottom panel). he dotted lines are the sample
.
,
.
,
.
,
.
,
.
,
.
,
.
,
.
,
.
-quantile lines based on
trajectories of the risk process. From XploRe


