Graphics Reference
In-Depth Information
Figure
.
.
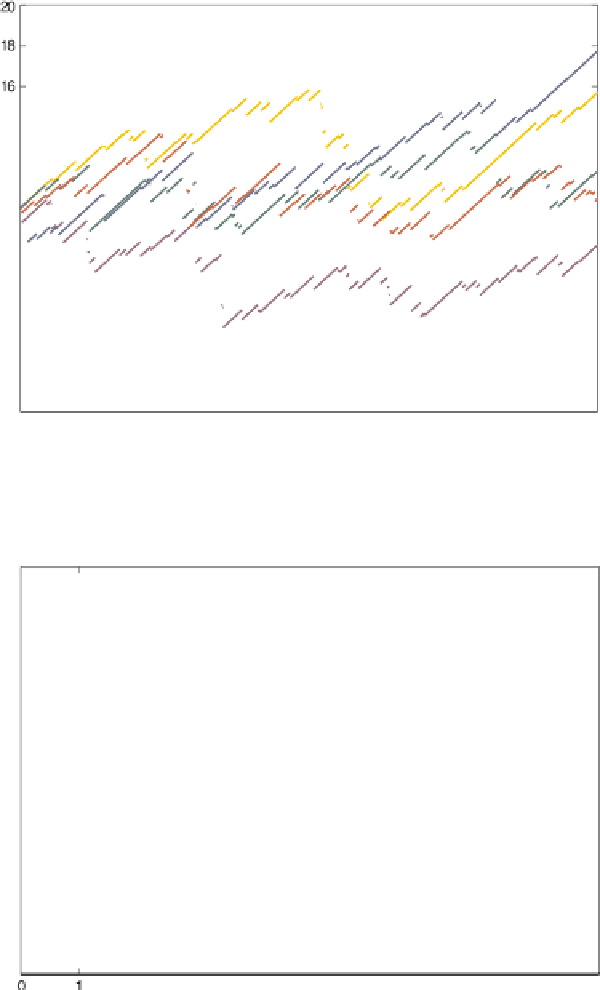
Discontinuous visualization of the trajectories of a risk process. he initial capital u
=
million DKK, the relative safety loading θ
=
.
, the claim size distribution is log-normal with
parameters μ
=
.
and σ
=
.
, and the driving counting process is a HPP with monthly
intensity λ
=
.
. From the Ruin Probabilities Toolbox
Figure
.
.
Alternative (continuous) visualization of the trajectories of a risk process. he bankruptcy
time is denoted by a star. he parameters of the risk process are the same as in Fig.
.
. From the Ruin
Probabilities Toolbox