Graphics Reference
In-Depth Information
Figure
.
.
Log-normal probability plot of the PCS waiting time data. he x-axis corresponds to
logarithms of the losses. From the Ruin Probabilities Toolbox
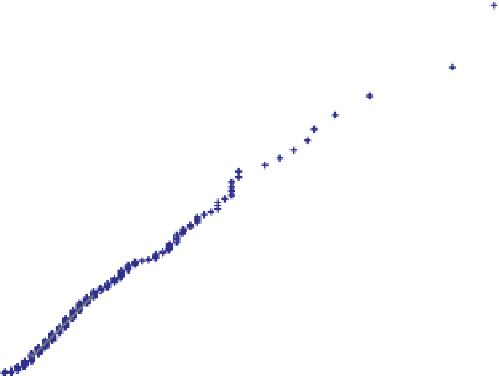
Figure
.
.
Exponential probability plot of the PCS waiting time data. he plot deviates from a straight
line at the far end. From the Ruin Probabilities Toolbox
hese probability plots suggest that, as far as the loss amounts are concerned, the
Pareto law provides a much better fit than the log-normal distribution. In fact, apart
from the two very extreme observations (Hurricane Andrew and Northridge Earth-