Graphics Reference
In-Depth Information
Figure
.
.
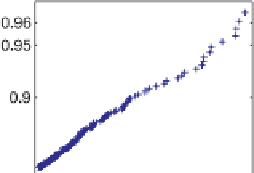
Pareto probability plot of the PCS loss data. Apart from the two very extreme observations
(Hurricane Andrew and Northridge Earthquake), the points (crosses) more or less constitute a straight
line, validating the choice of the Pareto distribution. he inset is a magnification of the bottom let part
of the original plot. From the Ruin Probabilities Toolbox
Figure
.
.
Log-normal probability plot of the PCS loss data. he x-axis corresponds to logarithms of
the losses. he deviations from the straight line at both ends question the adequacy of the log-normal
law. From the Ruin Probabilities Toolbox