Graphics Reference
In-Depth Information
ruin probability plot
density evolution plot
quantile lines
probability gates.
All four of these techniques permit an immediate evaluation of model adequacy and
the risks faced by the company based on visual inspection of the generated plots. As
suchtheyareespeciallyusefulforhigh-levelmanagerswhoareinterestedinageneral
overview of the situation and do not need to study all of the computational details
underlying the final results.
To illustrate the usefulness of the presented visualization tools, throughout this
chapter we will apply them to two datasets. he first one, studied in detail, is the
Property Claim Services (PCS) dataset, which covers losses resulting from catas-
trophic events in the USA. he data include
-
market loss amounts in US
dollars (USD), adjusted for inflation using the Consumer Price Index. Only natural
events thatcaused damageexceeding fivemilliondollars weretaken intoaccount,see
Fig.
.
. he second dataset, used here solely to illustrate the risk process inference
tools,concerns majorinflation-adjusted Danishfirelossesofprofit(inDanishKrone,
DKK) that occurred between
and
and were recorded by Copenhagen Re.
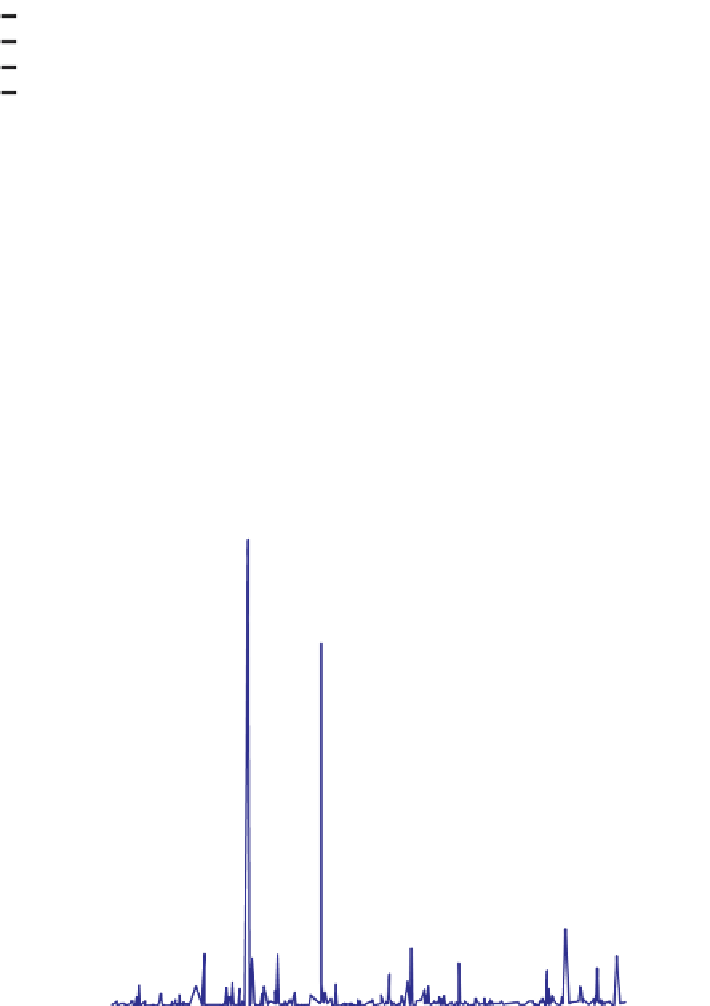
Figure
.
.
Graph of the PCS catastrophe loss data,
-
. he two largest losses in this period
were caused by Hurricane Andrew (
August
) and the Northridge Earthquake (
January
).
From XploRe