Graphics Reference
In-Depth Information
Figure
.
.
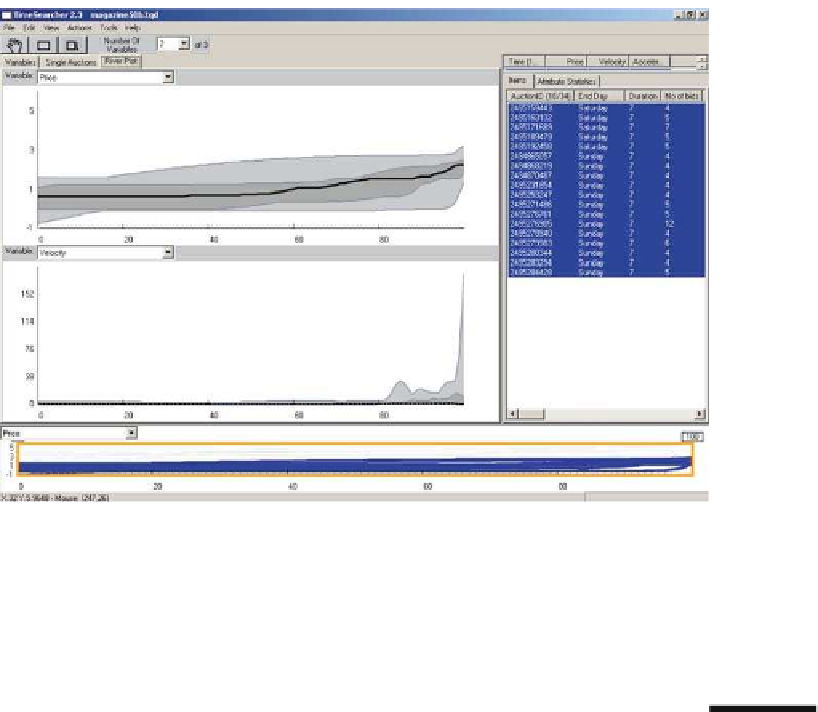
Riverplot of the subset of “similar" auctions. he thick black line is the pointwise median
used for forecasting. he dark gray bands around the median show the
and
% percentile range
and the light gray bands show the envelope for all similar auctions. his can be seen as a continuous
form of box plot
Further Challenges and Future Directions
5.6
Functional data analysis is an area of statistical research that is receiving a growing
amount ofinterest.Todate,mostofthis interesthascentered arounddeveloping new
functional models and techniques for estimating them, while little effort has been
expended on exploratory techniques, especially visualization. Classical statistics has
become very popular due to both the availability of a wide array of models and the
ability tochecktheappropriateness ofthese models.heresultsobtained byapplying
a particular model will only be wholeheartedly supported if the model is shown to
be appropriate. However, this requires that the data can be compared to the model.
In this sense, the widespread acceptance and usage of functional models is only go-
ing to happen when a range of visualization tools that perform similar tasks to their
counterparts in classical statistics are made available.
In this paper, we have outlined a variety of functional visualizations that are avail-
able. However, significant challenges remain. hese challenges range from concur-
rency of functional objects, to high dimensionality, to complex functional relation-
ships.