Graphics Reference
In-Depth Information
of f
, respectively. Knowledge of the dynamics can be important for pinpointing
the periods during whichthe auction price experiences only minorchange, whichin
turn is important for forecasting the final price (Wang et al.,
). he middle and
right panels of Fig.
.
show the velocity and acceleration for the
eBay auctions
together with the pointwise mean and confidence bounds.
Another wayof investigating the interplay of dynamics is with the aid of so-called
phase-plane plots. Phase-plane plots graph dynamics against one another. For in-
stance, Fig.
.
shows a graph of mean velocity versus mean acceleration. he num-
bers on the curve indicate the day of the auction. We can see that at the start (day
),
high velocity is accompanied by low, negative acceleration (=deceleration). Accel-
eration precedes velocity, so deceleration now results in a lower velocity tomorrow,
and consequently the velocity decreases to below
.
on day
. his trend continues
until the acceleration turns positive (between days
and
), causing the velocity to
pickup towards the endof the auction end.Phase-plane plots are useful for diagnos-
ing whether the interplay of dynamics suggests a system that could be modeled by
a suitable differential equation.
(
t
)
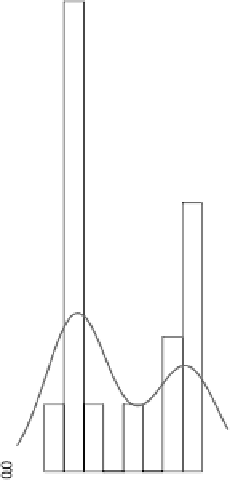
Figure
.
.
Distribution of functional objects: histograms of price (plotted on a log scale) at days
,
and
of the
eBay online auctions. he gray line corresponds to a kernel density estimate with
aGaussiankernel