Graphics Reference
In-Depth Information
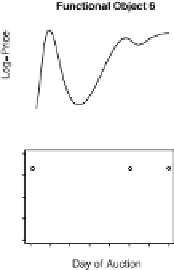
used the resulting functional objects for subsequent analysis. However, as we will
explain next, two of the three approaches lead to very unrepresentative functional
objects and therefore probably to erroneous conclusions.
Statistical conclusions typically make sense only in the context of their applica-
tion, and ignorance thereof will lead to wrong conclusions. his is no different for
visualizations. As mentioned earlier, Figs.
.
-
.
show bidding data from
eBay
auctions.Allauctionsareforthesameitem(aPalm PDA M
personal digital as-
sistant), all lasted seven days, and all auctions were collected during the same time
period (March to June,
) and had a retail value of about $
at the time of col-
lection. In that sense, all
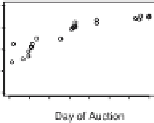
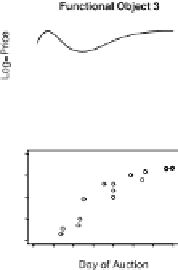
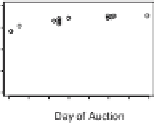
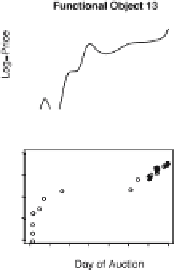
auctions are comparable. he circles correspond to the
observed bids (i.e., the times and sizes of the bids), while the solid lines correspond
to the resulting functional objects via penalized smoothing splines. he objective at
this stage is to recover, from the observed bidding data, the underlying price curve.
he price curve describes the price evolution during an auction, and its derivatives
measure the price dynamics. In that sense, the objective is to create a functional ob-
ject that is representative of the evolution of price between the start and end of the
seven-day auction. he process of bidding on eBay follows an ascending format and
the price curve should naturally reflect that. his goal is somewhat complicated by
Figure
.
.
Creating functional objects: price curves using penalized smoothing splines with p
=
and
λ
.
. Note that the x-axis denotes the day of the auction, which is between
and
, and the y-axis
denotes the auction price on a log scale
=