Graphics Reference
In-Depth Information
Figure
.
.
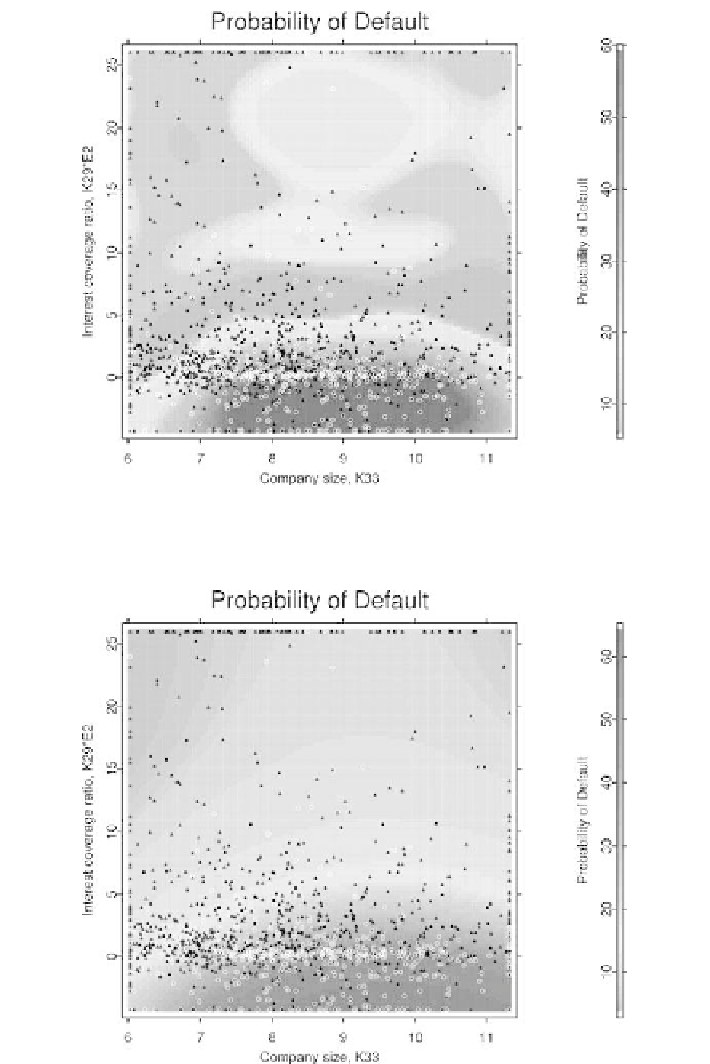
Probability of default, estimated for a random subsample of
failing and
surviving
companies, and plotted for the variables K
and K
. An SVM of high complexity with a radial basis
kernel of
.
Σ
was used
Figure
.
.
Probability of default, estimated for a random subsample of
failing and
surviving
companies, and plotted for the variables K
and K
. An SVM of average complexity with a radial
basis kernel of
Σ
was used