Graphics Reference
In-Depth Information
hethree figures therefore correspond tothree SVMs with high, average and high
complexity. he saturation was fixed at
.
to make the colours look more natural
and sot, and the luminance was fixed at
.
, the maximum possible value for the
chosen saturation. he HLScolours obtained in this waywere transformed into RGB
ones and plotted by XploRe (Härdle et al.,
b,a) as a contour plot. he outliers
that lie beyond the
% and
% quantiles are plotted at the edge.
Toproducethe plot,agridwasgenerated with
stepsinboth the horizontal and
vertical directions. For each point of the grid, a PD was estimated and represented
in the HLS colour space. hen the HLS colour was converted into an RGB colour
Figure
.
.
[his figure also appears in the color insert.] he luminance and saturation dimensions of
the HLS colour space. We will keep luminance and saturation constant and encode PD information
with the hue
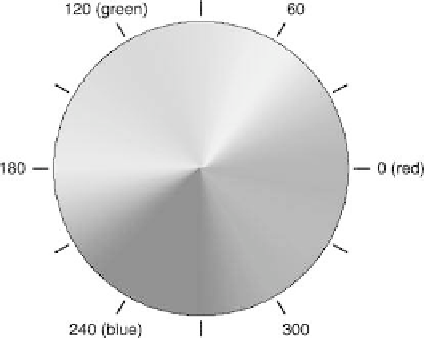
Figure
.
.
[his figure also appears in the color insert.] he hue dimension of the HLS colour space


