Graphics Reference
In-Depth Information
Figure
.
.
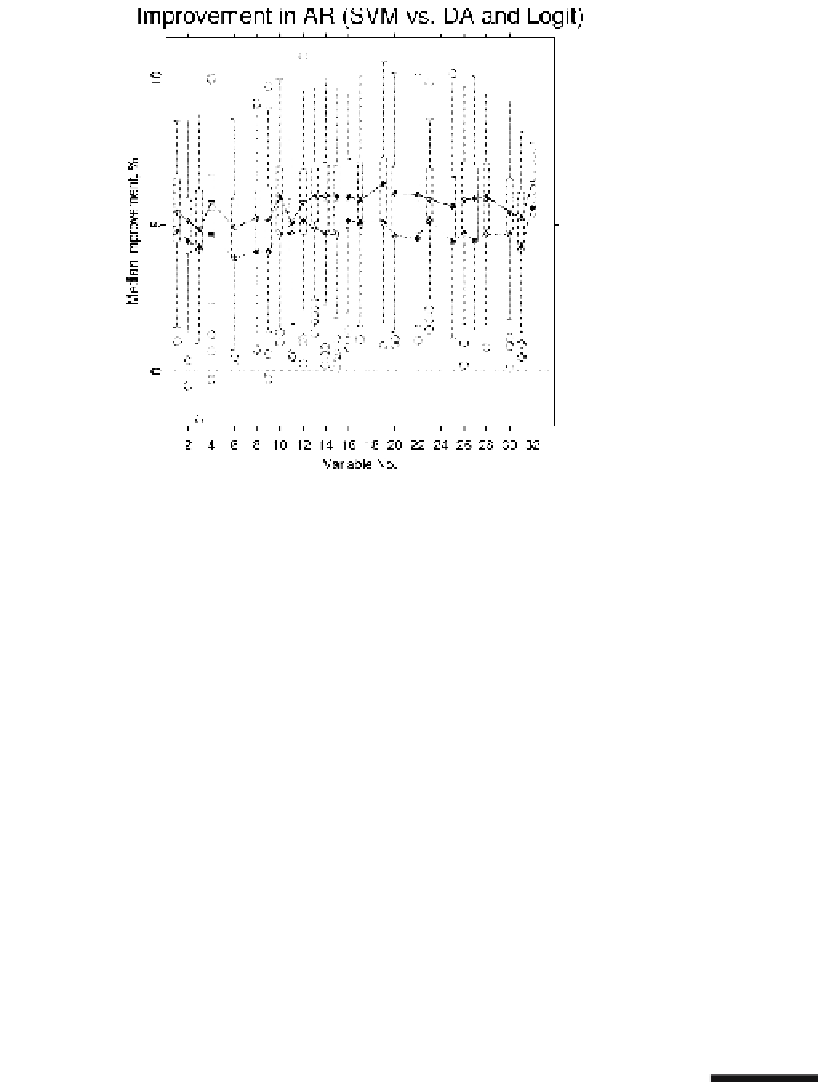
Median improvement in AR. SVM vs. DA (upper line) and SVM vs. logit regression (lower
line). Box plots are estimated based on
random subsamples for the case of DA. Each model includes
variables K
, K
, K
, K
, K
, K
, K
, and one of the remaining variables
the SVM significantly outperforms DA and the logit regression for a sample of
observations, it will also do so for larger samples.
he SVM based on the variables K
, K
, K
, K
, K
, K
, K
, K
, and K
attains the highest median AR, around
.
%.For comparison we plot the improve-
ment in AR for the SVM vs. DA and logit regression for the same
subsamples.
hedata used in the DA and logit models were processed as follows: if x
i
<
q
.
(
x
i
)
then x
i
is
an α quantile of x
i
. hus, the DA and logit regressions applied were robust versions
that werenotsensitive tooutliers. Withoutsuchaproceduretheimprovement would
be much higher.
Figure
.
represents the absolute improvement obtained by SVM over DA (up-
per line) and SVM over logit regression (lower line). We can see that, for all models
containing the variables K
, K
, K
, K
, K
, K
, K
and one of the remaining
variables, the median AR was always higher for the SVM. his means that the SVM
model always outperforms DA and logit regressions with regard to AR.
=
q
.
(
x
)
,andifx
i
q
.
(
x
i
)
then x
i
=
q
.
(
x
i
)
; i
=
,
,...,
;q
α
(
x
i
)
Conversion of Scores into PDs
4.5
here is another way to look at the company score. It defines the distance between
companies in terms of the distance to the boundary between the classes. he lower