Graphics Reference
In-Depth Information
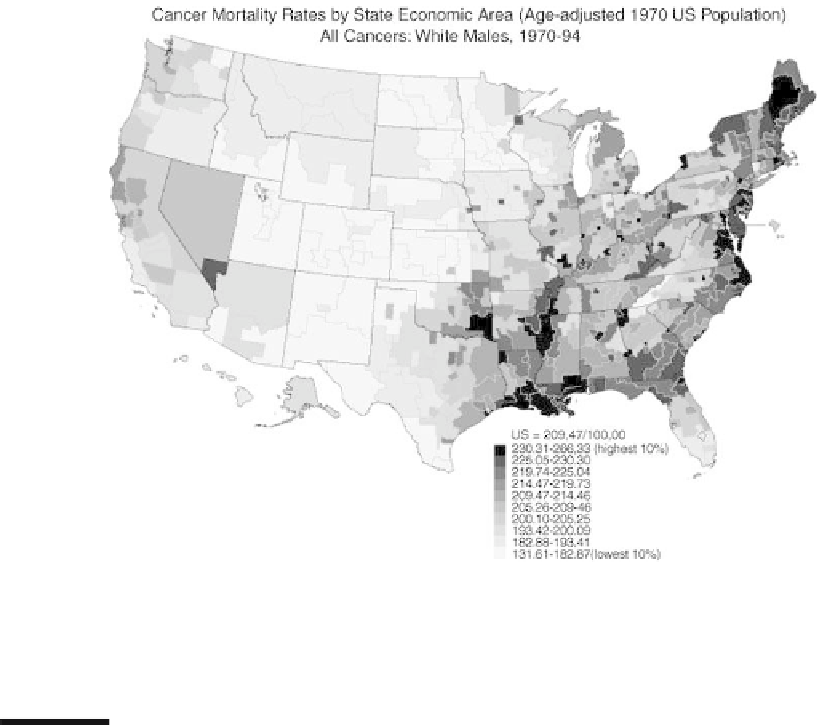
Figure
.
.
Cancer mortality rates for white males in the USA between
and
by State
Economic Area. he scale has been chosen so that each interval contains
% of the SEAs. Source:
http://www
.cancer.gov/atlasplus/
Practical Advice
2.6
Software
2.6.1
For a long time all graphics had to be prepared by dratsmen by hand. he volumes
of the Album de Statistique Graphique produced towards the end of the
th cen-
tury contain many exceptional displays which must have taken much painstaking
preparation. Such graphics may be individually designed with special features for
the particular data involved. Nowadays graphics are produced by sotware, and this
has tended to mean that certain default displays are adopted by many as a matter of
course.Ifittakes afewminutestoprepareagraphicthatisstandard inyourfield,why
bother to prepare something novel? his has advantages - standards avoid possible
grosserrorsandarereadilyunderstoodbyreadersfamiliarwiththem-anddisad-
vantages -notalldata fittheexisting standards andinteresting newinformation may
be obscured rather than emphasized by a default display. As sotware becomes more
sophisticated and user interfaces become more intuitive, this may change. Currently
(in
), there are sotware packages which give users substantial control over all
aspects of the displays they wish to draw, but these are still only for experts in the