Graphics Reference
In-Depth Information
Figure
.
.
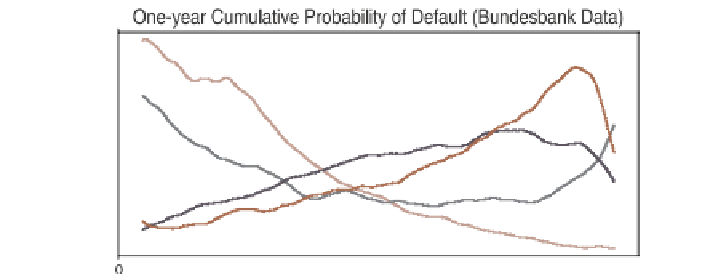
One-year cumulative PDs evaluated for several financial ratios from the German
Bundesbank data. he ratios are net income change (K
), net interest ratio (K
), interest coverage
ratio (K
), and logarithm of total assets (K
). he k nearest neighbors procedure was used with
a window size of around
% of all of the observations. he total number of observations is
heneuralnetwork(NN)(Rosenblatt,
;MinskyandPapert,
)isanetwork
oflinear classifiers(neurons) that areconnected tooneanother inaprespecifiedway.
he outputs of some of the neurons are inputs for others. he performance of a NN
greatly depends on its structure, which must be adapted to solve different problems.
henetwork mustbedesignedmanually, whichrequires substantial operatorexperi-
ence. Moreover, NNs do not usually provide a global solution, only a local one that is
validforsomerangeofvariables.hisfeatureandthemanyheuristicsinvolvedmake
NNs di
cult to use in the rating departments of banks.
We would like to have a model that is able to select a classifying function based
on very general criteria. he SVM is a statistical technique that in many applica-
tions, such as optical character recognition and medical diagnostics, has shown very
good performance. It has a flexible solution and is controlled by adjusting only a few
parameters. Its overall good performance and flexibility make the SVM a suitable
candidate (Härdle et al.,
a).
Within a rating methodology, each company is described by a set of variables x,
such as financial ratios. Financial ratios, such as debt ratio (leverage) or interest cov-
erage (earnings before interest and taxes to interest) characterise different sides of
company operation. heyare constructed based on balance sheets and income state-
ments. For example, the Bundesbank uses
ratios (predictors) computed using the
company statements fromits corporate bankruptcy database. he predictorsand ba-
sicstatistics are given in Table
.
.hewhole Bundesbank database covers the period
-
and consists of
anonymised statements of solvent and insolvent
companies. Most companies appear in the database several times in different years.
he class y of a company can be either y
=−
(“successful”) or y
=
(“bankrupt”).
Initially, an unknown classifier function f
x
y is estimated for a training set of
companies
,...,n. he training set represents the data for companies
that are known to have survived or gone bankrupt. In order to obtain PDs from the
estimated scores f , financial analysts rely on verbally defined classes such as CCC,
(
x
i
, y
i
)
, i
=