Graphics Reference
In-Depth Information
Figure
.
.
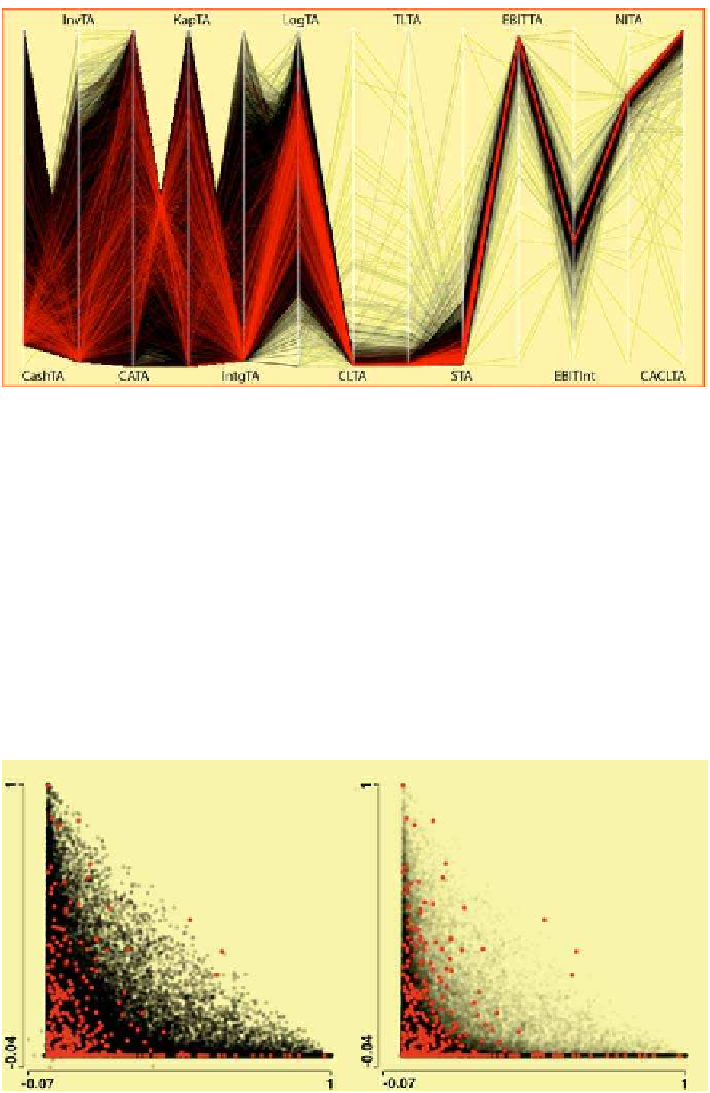
Parallel coordinate plot of financial ratios and logTA, excluding
outliers, with bankrupt
companies highlighted, α-blending=
.
for selected and unselected data
he utilization of selection and linking for scatterplots can be highly effective,
but it is dependent on the data distribution. Consider the two variables just men-
tioned above, Cash.TA and Intg.TA, and their distribution for the companies that
went bankrupt. A scatterplot can be drawn with a little α-blending,asshownonthe
letofFig.
.
,orwithalotof α-blending,asshownontheright.(α-Blendinghasnot
been used for the highlighted cases, as they then disappear on this scale.) Both plots
contribute information but neither is fully satisfactory. Another alternative would be
to draw a pair of scatterplots, one for each of the two groups of companies, but this is
di
culttointerpret.hesuccessofaparticular plotdependsonthere beingclear-cut
Figure
.
.
Scatterplots of the ratios of intangibles and cash to total assets, with companies that went
bankrupt selected. More α-blending has been used in the right-hand plot