Graphics Reference
In-Depth Information
Figure
.
.
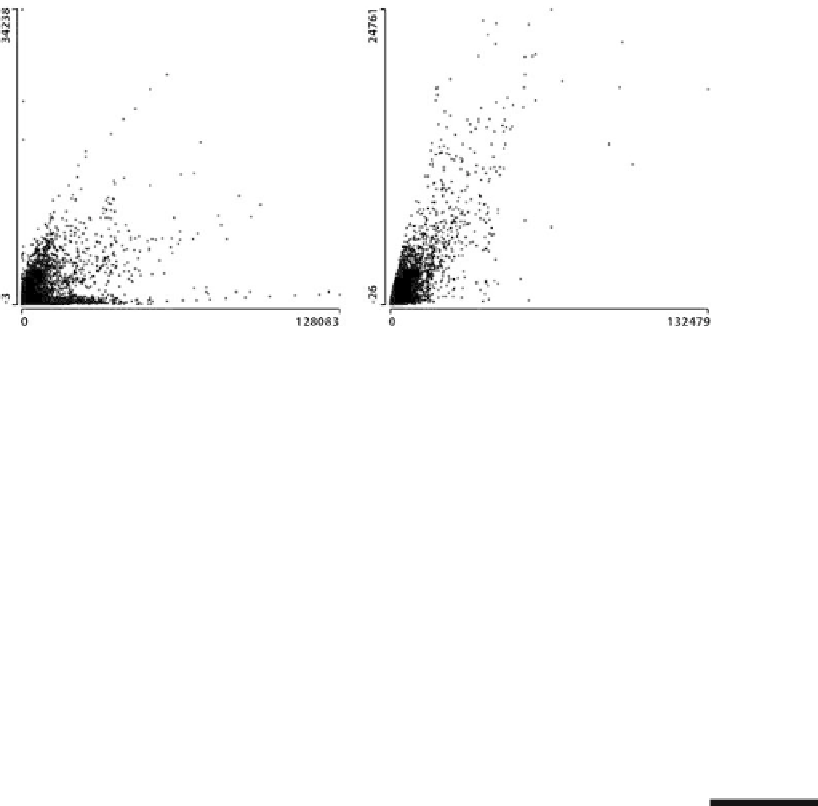
Scatterplots of inventories against fixed assets (let) and of cash against current assets
(right)
sets (Fig.
.
). Querying and linking can be used to identify specific sectors or out-
liers. he companies with high assets and low inventories are in the information and
communications sector. Companies in the retail sector have higher inventories and
lowerassets. he three points tothe top let in the inventories/fixed assets plot which
initially appear to be unusual are from investment banking and are consistent with
other companies in that sector - except for being considerably bigger. he biggest
companies for both variables in the let-hand plot are car manufacturers (higher in-
ventories) and oil companies (higher assets).
Sometimes features stand out in a parallel coordinate plot, while sometimes they
are more visible in raw data scatterplots. As always, a range of different graphics
should be explored.
Mosaic Plots
3.6
Combinations of categorical variables can be displayed in mosaicplots of various
kinds (Hofmann,
). However, if we attempt to draw such plots we encounter
two di
culties. Firstly, all but one of the categorical variables have a large number
of categories (there are
states and
NAICS categories). Secondly, the one cat-
egorical variable that is binary (BANKR) comprises less than
% of the cases in one
category, so that highlighting is rarely visible. he first problem can be circumvented
to some degree by grouping, combining states into regions, and using a less detailed
form of the NAICS. he second problem can be solved by using a special form of
zooming.
Figure
.
shows a fluctuation diagram of the numbers of companies by industry
sectorandregion.Classicalmosaicplotstrytomakethemoste
cientuseofthespace
available by making each cell as large as possible. his can make the plot di
cult to
interpret, especially when there are many cells. Fluctuation diagrams preserve a grid