Graphics Reference
In-Depth Information
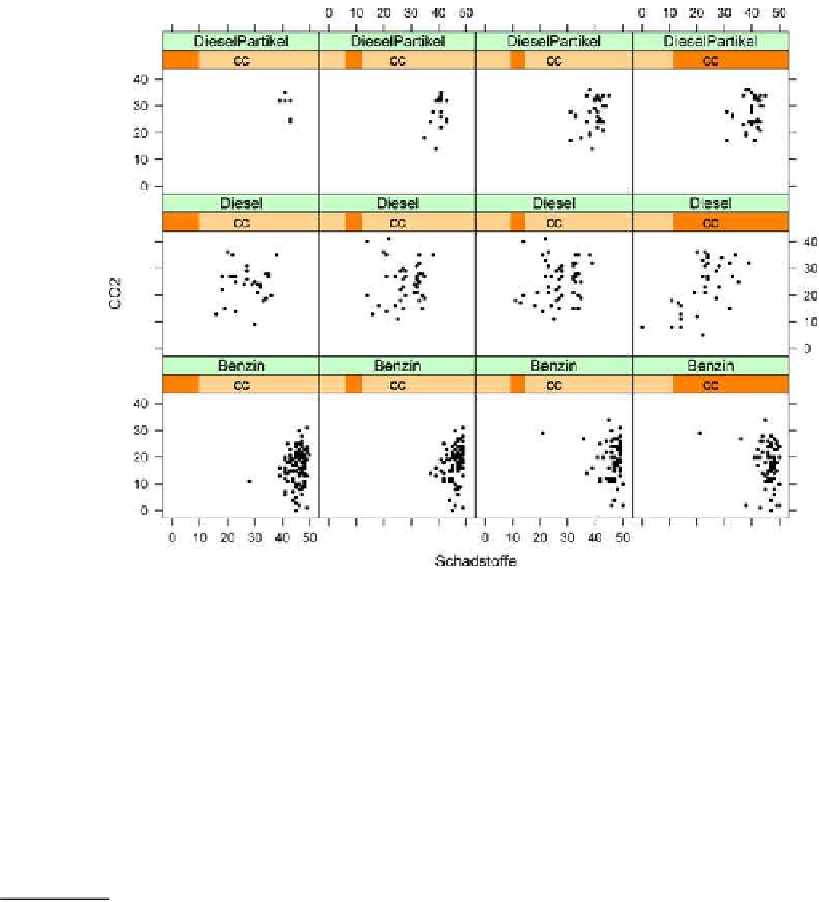
Figure
.
.
Trellis display of car emissions data from Germany. Each panel is a scatterplot of two
pollution measures. Rows:typeofengine;columns: engine size. Source: http://www.adac.de, March
engines in particular being different from the other two types. here are a few local
outliers amongst the petrol cars.
When several plots of the same kind are displayed, they can be plots of subsets of
thesame data, asintrellis displays,orplotsof different variables forthe same dataset,
as in a parallel coordinates plot. It should always be obvious from the display which
is the case.
Time Series and Maps
2.5.5
Time Series
Time series are special because of the strict ordering of the data, and good displays
respect temporal ordering. It is useful to differentiate between value measurements
at particular time points (e.g. a patient's weight or a share price) and summary mea-
surements over a period (e.g. how much the patient ate in the last month or how
many shares were traded during the day).
Time scales have to be carefully chosen. he choice of time origin is particularly
important, asanyone wholooks at theadvertised performance offinancial fundswill
know. Time points for value measurements may not match the calendar scale (e.g.