Graphics Reference
In-Depth Information
Figure
.
.
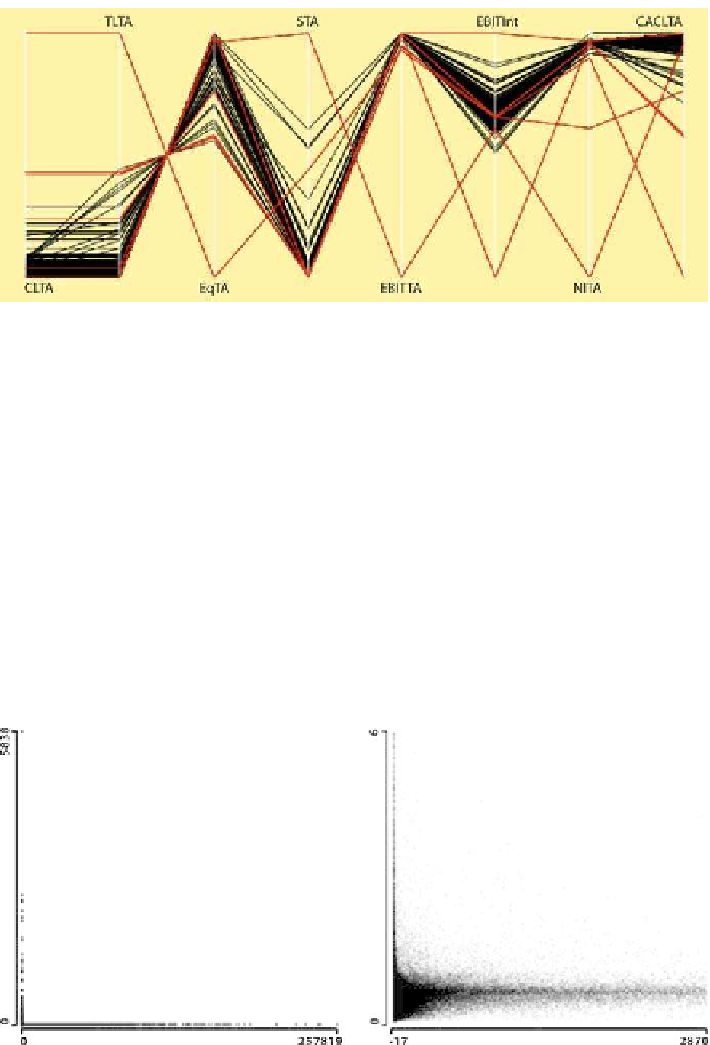
[his figure also appears in the color insert.] Parallel coordinate plot of financial ratios with
skew distributions. Seven outliers have been selected
and seven of the worst outliers selected. It is easy to see that several are outliers for
morethan onevariable. Itisalsoapparent that theratio ofequity tototalassets Eq.TA
is perfectly inversely correlated with the ratio of total liabilities to total assets TL.TA.
hisisamatterofdefinition,withTL.TA
. Although this equation looks
innocuous, it masks the fact that TL.TA ranges from
to
in this dataset. Not
surprisingly, the high values of TL.TA only arise for low values of Total Assets,asthe
L-shaped scatterplot on the let of Fig.
.
shows. his plot is somewhat misleading.
he zoomed version on the right reveals that there is more variability amongst the
lowvalues than the default plot suggests, although the most extreme values of TL.TA
stillonlyoccurforverylowvaluesofTotal Assets. he bulk of the pattern suggests
that very small companies have a broader range of possible liability ratio values than
small companies. he low-density region to the lower right implies that companies
+
Eq.TA
=
Figure
.
.
Scatterplots of TL.TA, the ratio of total liabilities to total assets, plotted against Total Assets.
he let-hand plot presents all of the data, and it shows that all high values of liabilities are associated
with low asset values. he right-hand plot presents a zoom of about
−
on the x-axis by
−
on the
y-axis, along with some α-blending