Graphics Reference
In-Depth Information
Figure
.
.
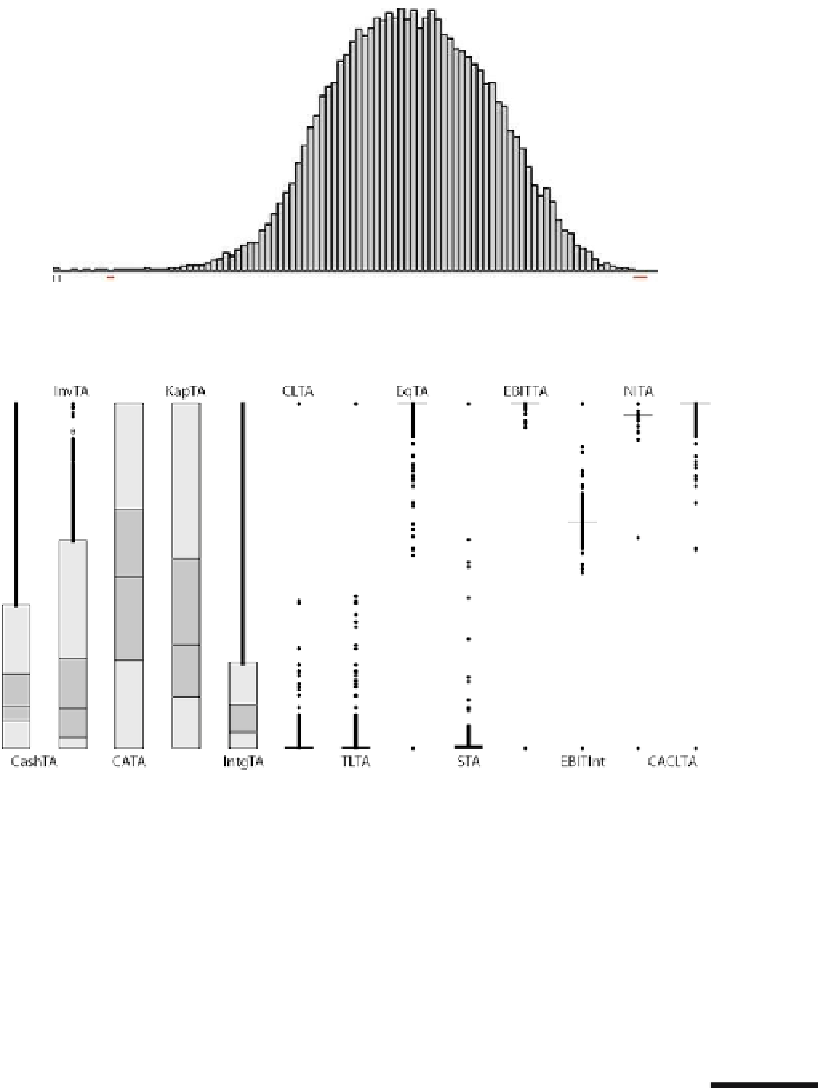
A histogram of log(Total Assets), logTA, for the companies. he marks below the axis to the
let are interactive controls for the anchorpoint and binwidth. he horizontal (red) marks record bins
where the count is too small to be drawn
Figure
.
.
Parallel boxplots of financial ratios. Each boxplot is individually scaled
A set of parallel boxplots for the ratio variables is shown in Fig.
.
. he boxplots
reveal that several of the ratios are highly skewed, and this may affect whether they
can be of much help in discriminating between the companies which went bankrupt
and those which did not. It is possible that many of these outliers are errors of some
kind, and it may be that most of the outliers for individual variables are actually out-
liers for several variables.
Outliers
3.4
Outliers can be checked with a parallel coordinates display (Inselberg,
), as in
Fig.
.
, where the eight ratios with highly skewed distributions have been plotted