Graphics Reference
In-Depth Information
a few are very large. Can the same financial ratios really be used for companies that
aresodifferentinscale?hisisthekindofquestion that exploratoryanalysis canhelp
us to answer by looking at the distributions of data values for the different groups.
heassumption is that results fromthis dataset can beapplied todatasets collected
in a similar fashion in the future.
First Graphics
3.3
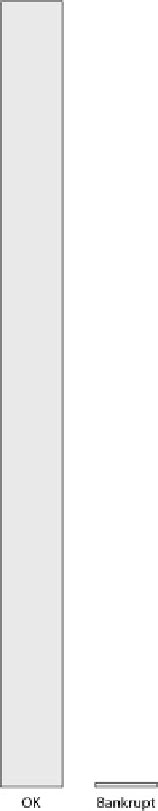
Figure
.
is a barchart for the bankruptcy variable. Only
a small proportion of companies actually went bankrupt,
which is a good thing for the companies, but it makes any
statistical analysis more di
cult.
he displays in Figs.
.
and
.
show that the compa-
niesarefairlyequallydistributedacrosstheregions,butthat
some of the data are surprisingly old, with a few cases prior
to the mid
s. In the
s there is one record per year,
and by linking to the geographic data we can show that this
was not always for the same company, as might have been
suspected.
he geographic information was originally provided by
State, so there were many small counts and only a few
big ones. Grouping by region gives a good overview, al-
though other groupings (e.g., by population) could also be
attempted. heregional classification usedhere is onefrom
the FBI. Selecting the foreign group (comprising a little
more than
% of the cases) and linking to a spinogram
(Hofmann and heus, submitted) of years (see Fig.
.
)
shows that the percentage of foreign registered companies
has increased over the years. Querying shows that this per-
centage increases from about
% in the early
s to
%
in
. In the most recent year,
, the rate falls to just
under
%. It is expensive for foreign firms to be listed on
theUSexchanges, and opinionhas changed astowhatben-
efits it brings. heSarbanes-Oxley Act has also made it less
attractive to be listed in the US.
Information was also available on industry sector in two
different ways; one classification involved
categories by
nameandnumericalcoding,whiletheNAICSclassification
used number, and had
categories. Both are too detailed
for graphical analysis, and a hierarchical grouping similar
to the spatial grouping of the States can be attempted. he
six-digit NAICS codes can be aggregated by their first two
digits and then further grouped by sector to give Fig.
.
.
Figure
.
.
Abankruptcy
barchart.
of the
records refer to bankruptcy