Graphics Reference
In-Depth Information
Figure
.
.
Derivation of the distance map. he underlying liver ultrasound image is decomposed into
overlapping blocks of subimages. Each block is filtered with a set of Gabor functions to derive its
G-vector. he distance map is formed from the G-vector lengths of all blocks
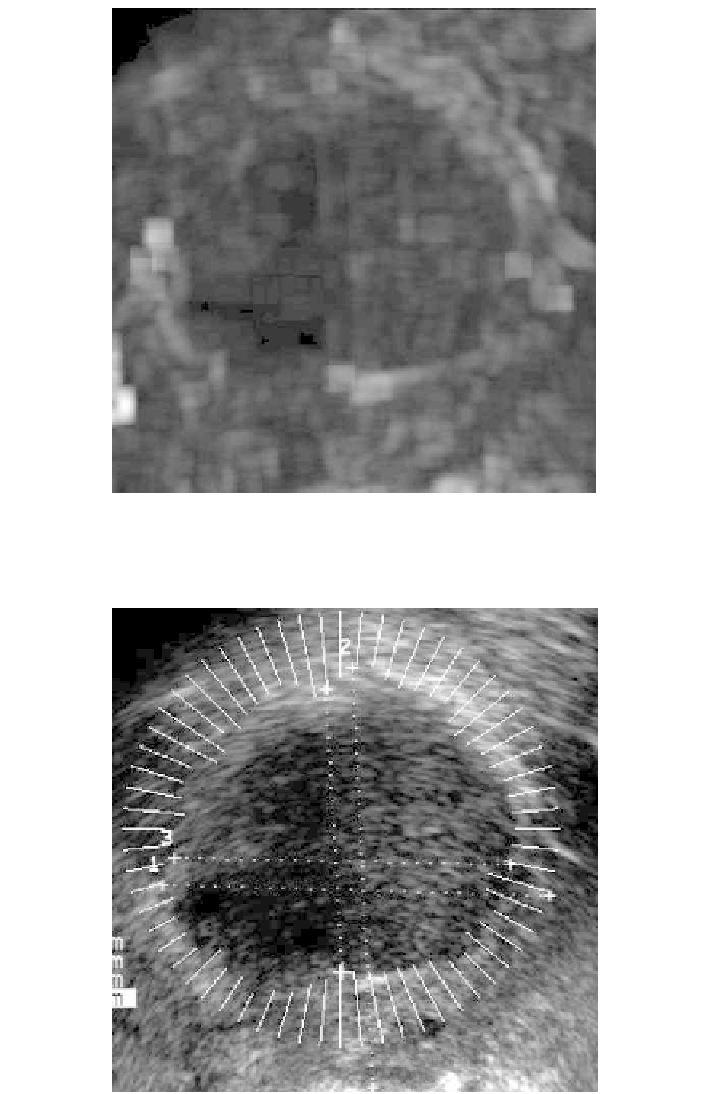
Figure
.
.
he boundaries derived by the proposed snake model are plotted; the initial contours and
the derived boundaries are as indicated