Graphics Reference
In-Depth Information
Figure
.
.
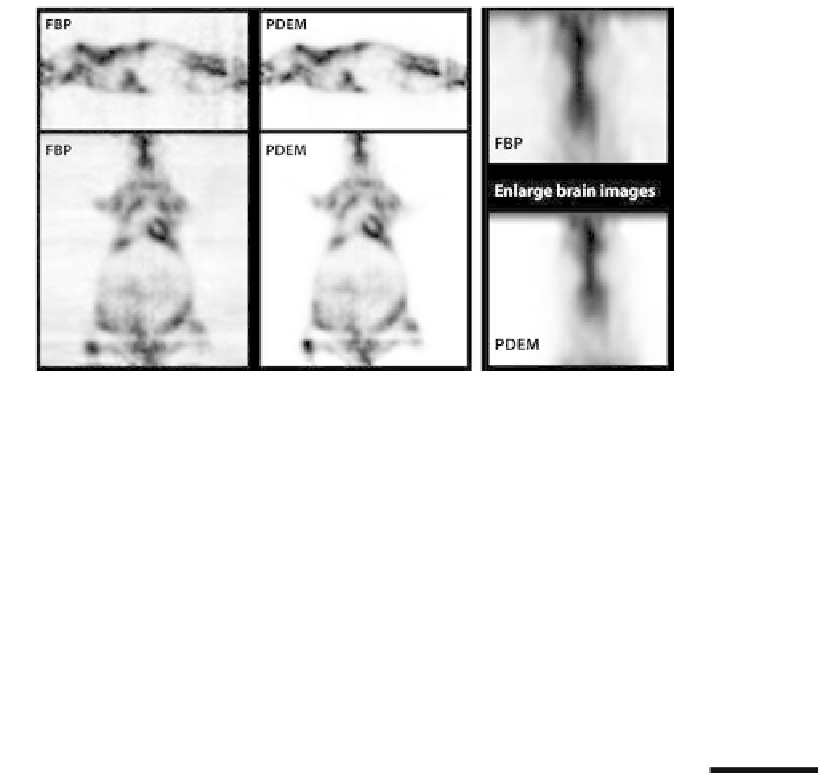
Coronal and sagittal images of a mouse reconstructed by PDEM (right)andFBP(let). he
images reconstructed by PDEM have less noise than those reconstructed by FBP. he enlarged brain
image reconstructed by PDEM has clearer boundaries than that reconstructed by FBP
he signal-to-noise ratio (SNR) is used to compare the quality of the reconstructed
microPET images of the experimental phantom obtained by filtered backprojection
(FBP)andPDEMmethods.heresults reveal that PDEMoffershigherimagequality
thanFBPdoes.Acomparison ofthesetwomethodsforthemicroPETreconstruction
of a real mouse is shown in Fig.
.
. More studies and comparisons are discussed in
Chen et al. (
).
Ultrasound Images
2.3
henoninvasive, real-time, convenient and economical propertiesof ultrasound im-
ages have resulted in their widespread clinical application to the early detection of
several diseases and routine monitoring in clinical practice. However, it is di
cult to
segment the regions of tumors, for example, because of the low signal-to-noise ratio
ofspecklenoises inultrasound images (Burckhardt,
;Goodman,
).hereare
several possible computational statistical methods that can be used to address these
issues during the analysis of ultrasound images.
An ultrasound image can be regarded as a type of texture image, and therefore
the segmentation methods of texture images can be considered. Inspired by recent
studies of the early vision system and human V
cells, image synthesis and the seg-
mentation ofstatic imagesbasedonaspatial-frequential analysis that mimicshuman
vision were investigated (Malik and Perona,
; Jain and Farrokhnia,
; Dunn
et al.,
; Tan,
; Zhu et al.,
). Recent progress has been made in modeling
textures and dynamic textures using statistical models (Wu et al.,
; Zhu et al.,