Graphics Reference
In-Depth Information
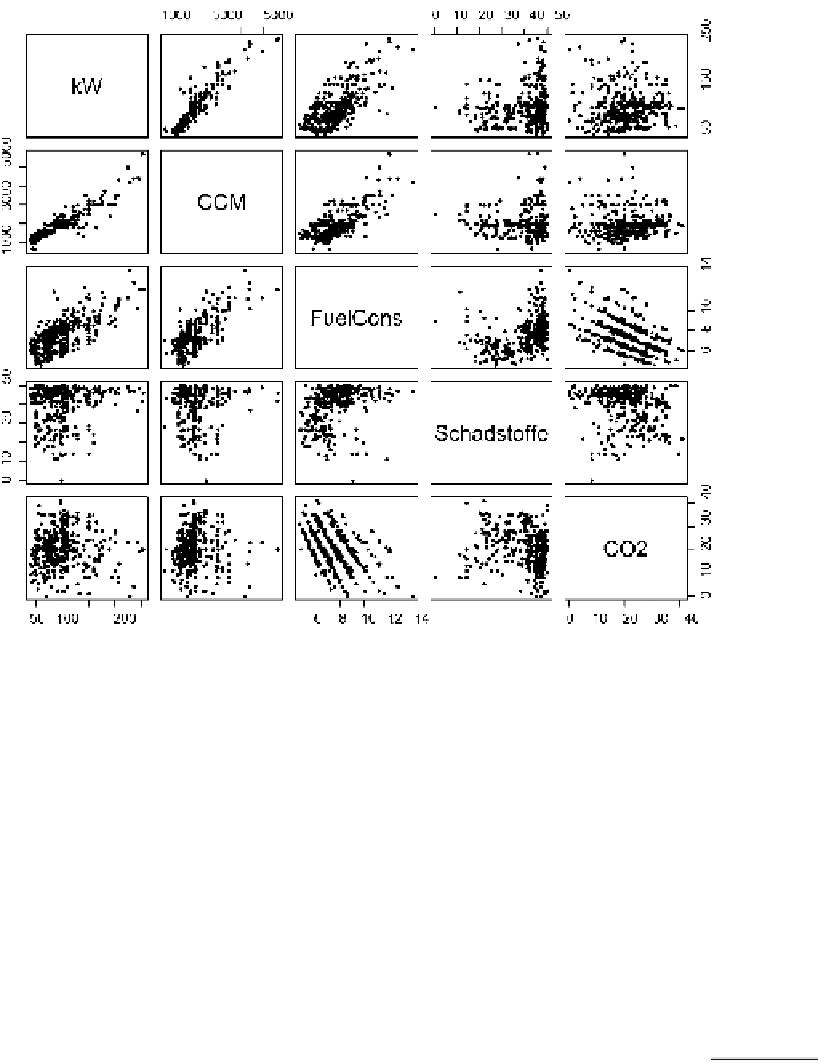
Figure
.
.
A scatterplot matrix of the five main continuous variables from a car emissions dataset
from Germany. Source: http://www.adac.de, March
crosses many others downwards). Note that there are relatively few line crossings
over the later stages of the race, which means, perhaps surprisingly, that not many
riders changed their race ranking.
his graphic might be improved in a number of ways: the axes could be labelled
(though there is little space for this); the vertical axes could be drawn less strongly;
scale information could be added (the range of the vertical axes is about
h, though
precise values would be better read off a table of results); and the level of α-blending
might be varied across the display.
Figure
.
shows a special form of parallel coordinate plot. Usually each axis has
its own scale and there is no natural ordering of the axes. Other examples of parallel
coordinate plots can be found in other chapters of the Handbook.
Mosaic Plots
2.5.3
Mosaic plots display the counts in multivariate contingency tables. here are various
types of mosaicplot (Hofmann,
) and a
-D example of a doubledecker plot is
displayed in Fig.
.
. he data are from a study of patterns of arrest based on