Graphics Reference
In-Depth Information
Figure
.
.
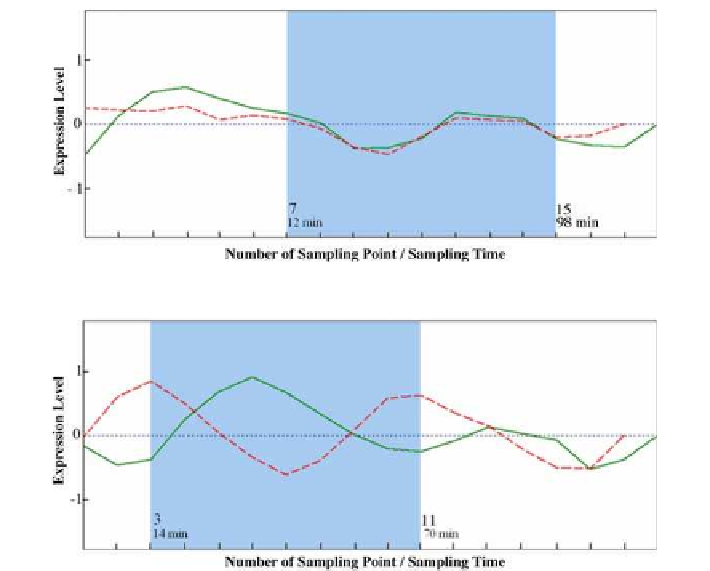
he gene expression pattern of Activator (solid line)-Target (dashed line) genes over time
Figure
.
.
he gene expression pattern of Repressor (solid line)-Target (dashed line) genes over time
bymany quantitative RT-PCT-confirmed gene pairs. his motivated Chuang and his
colleagues todevelop a pattern-recognition method that extracts the features of time
course microarray data from confirmed gene pairs; the method was then applied to
predictsimilar interactions amonggenesofinterest.Specifically, theygeneralized the
snakeenergymodel(SEM)(Kassetal.,
)byincorporatingtheparticleswarmop-
timization (PSO) algorithm and a criterion including the areas enclosed by the AT
and RT curves. Moreover, a cost function was integrated into the SEM to improve
its discrimination power. his method is called the extended snake energy model
(eSEM).
Typical indicators of acompensatory relationship are redundant genes (paralogs),
redundant pathways, and synthetic sick or lethal (SSL) interactions (Wong and Roth,
).Amongthe
yeastgenesofinterest,those
geneswhoseTCandTDinterac-
tions were confirmed by RT-PCR experiments were focused upon (see the appendix
of Chuang et al. (
) for details). eSEM was applied to the cDNA microarray data
in Spellman et al. (
) to infer TC and TD interactions. For the alpha data set, ex-
periment and control groups were mRNAs extracted from yeast cultures which were
synchronized by alpha factor arrest and unsynchronized, respectively; there are
time points with no replicates. A full description and complete data sets are avail-
able at http://cellcycle-www.stanford.edu. he red (R) and green (G) fluorescence
intensities were measured from the mRNA abundance in the experiment group and