Graphics Reference
In-Depth Information
β
i
, β
i
, β
i
where i
=
,
,
. hose
data-fitted models
(
)
(denoted by +) and Xu's
model in (
.
) (denoted by
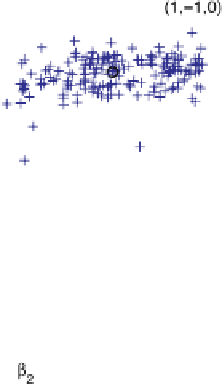
) are plotted in Fig.
.
. Figure
.
clearly shows that Xu's
model does not fit the cluster of
β
i
, β
i
, β
i
points well. Instead, the center point
of the clustered points could be a better fit. his confirmed the intuition that the
A-R-T model should be data-driven. his data-driven response surface was devel-
oped as follows.
Among those models (surfaces) fitted well by microarray data of triplets, the fol-
lowing method was employed to determine exactly one surface, called the mode sur-
face, that most of the triplets are close to. For any given i,treating
(
)
β
i
, β
i
, β
i
, β
i
(
)
as a point in
R
, we partitioned
by Silverman's rule in nonparametric density
estimation (Scott,
; Härdle et al.,
).
Silverman's ruleis amethodthat determines the modeof points that existin high-
dimensional space;theformula tocomputethepartition numberforeachcoordinate
h
i
is:
[
,
]
n
−(
d
+)
,
h
i
=
.
min
s
i
, IQR
i
.
where s
i
and IQR
i
denote the standard error and interquartile range of the data in
coordinate i,andd is the dimensionality of the points to be partitioned. A general
Figure
.
.
β
, β
and β
of models fitted well to (
.
) and those of Xu's model, denoted by + and
,
respectively


