Graphics Reference
In-Depth Information
in particular, by the majority of triplets. Furthermore, a time lag was allowed in the
model for the target gene to respond to the influences of its activator and repressor.
Given n genes, in order to attain the surface that fits the majority of triplets (A, R,
T), the following regression model was fitted to all
n
ċ
! triplets:
T
i
(
t
+
)=
β
+
β
A
i
(
t
)+
β
R
i
(
t
)+
β
A
i
(
t
)
R
i
(
t
)
(
.
)
where
i
n, β
, β
andβ
R
.
<
tothe response surface with atime laghas the following bio-
logical bearing. Microarrays measure the concentration ofmRNAs,the lag
Fitting
A
t
, R
t
, T
t
+
(
)
intime
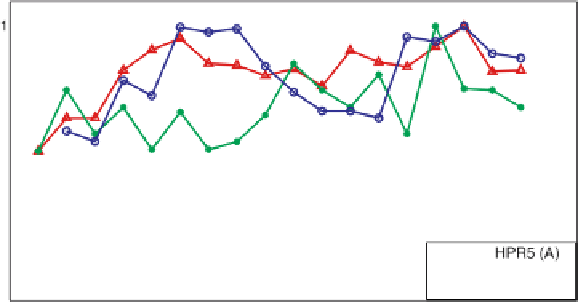
characterizes that mRNAs of gene A (R) translate into protein a (r) within the time
lag,then their protein a (r) activates (represses) its associated target gene. AnA-R-T
relationship, with T lagged
−
in time behind A and R, is depicted in Fig.
.
, where
the curves of R and T are roughly converse to each other but T's curve roughly fol-
lows A's. A few RT-PCR-confirmed A-R-T triplets have also shown similar patterns
to those in Fig.
.
; this reinforces the validity of the A-R-T model.
Time course microarray data for each triplet were fitted to the model in (
.
) to
obtain
−
β
i
, β
i
, β
i
, β
i
(
)
,wherei
=
,
, n
(
n
−
)(
n
−
)
and nisthenumberofgenes.
hatis,therewere n
(
n
−
)(
n
−
)
responsesurfaces (models)fitted intotal. Next,the
.
and all of the p-values of the β
i
must be
goodness-of-fit criteria that R
.
wereutilized toselectmodelsthat weregoodfits.Duetothemultiple testingproblem
(four β
i
values) and the significance level for entry in variable selection (Younger,
),
.
was set to be the threshold for all p-values. his threshold and that for R
can be adjusted according to the number of triplets that satisfy the goodness-of-fit
criterion. For instance, if there are relatively fewtriplets that satisfy the criterion, one
canloosenjustthethresholdforp-values or both thresholds.
To gain insights from
R
, triplets of
genes related to DNA synthesis and DNA
repair in yeast were fitted to the model in (
.
); those models where
<
β
i
, β
i
, β
i
(
)
.
and all p-values of β
i
satisfied the criterion that R
<
.
were retained,
Figure
.
.
he Activator-Repressor-Target pattern displayed by three genes in the alpha data set