Graphics Reference
In-Depth Information
Specifically, this time-lagged correlation approach comprised the following steps.
Step
:
Genes with low expression levels or low expression changes were filtered.
Furthermore, coexpressed genes (
.
), which are located adjacently in
DNAsequences,wereclustered.Allclusteredgenes(theiraveragedgeneprofiles)
andnonclusteredgenesweresubmittedforfurtheranalysisinStep
.
Step
:
Lag-τ correlations between expressionprofileswerecomputed,usingthein-
putsignal inthe firstiteration ortheaveraged profilesofeachsubgroupresulting
from Step
in subsequent iterations.
All clusters and genes with at least one
R
(
)
value that is greater than the pre-
specified threshold of
.
were retained for Step
.
Step
:
Genes retained from Step
were partitioned by the time-lag τ from their
lagged correlations. For instance, all genes that were best correlated with lag-
were grouped into category
. Within each category, a nearest neighbor cluster-
ing method (Dillon and Goldstein,
) was applied to cluster the genes into
subgroups using the usual correlation as the similarity metric.
Step
:
he significantly correlated groups in each category were used as “seed”
nodes in Step
to expand the interaction network. Iterations were then stopped,
provided that the network could not be further expanded for a given threshold.
Step
:
he Graphviz program from ATT research labs (http://www.graphviz.org/)
was adapted in order to minimize the crossovers in a given network, while the
sotware for displaying graphics was written in Matlab.
r
(
τ
)
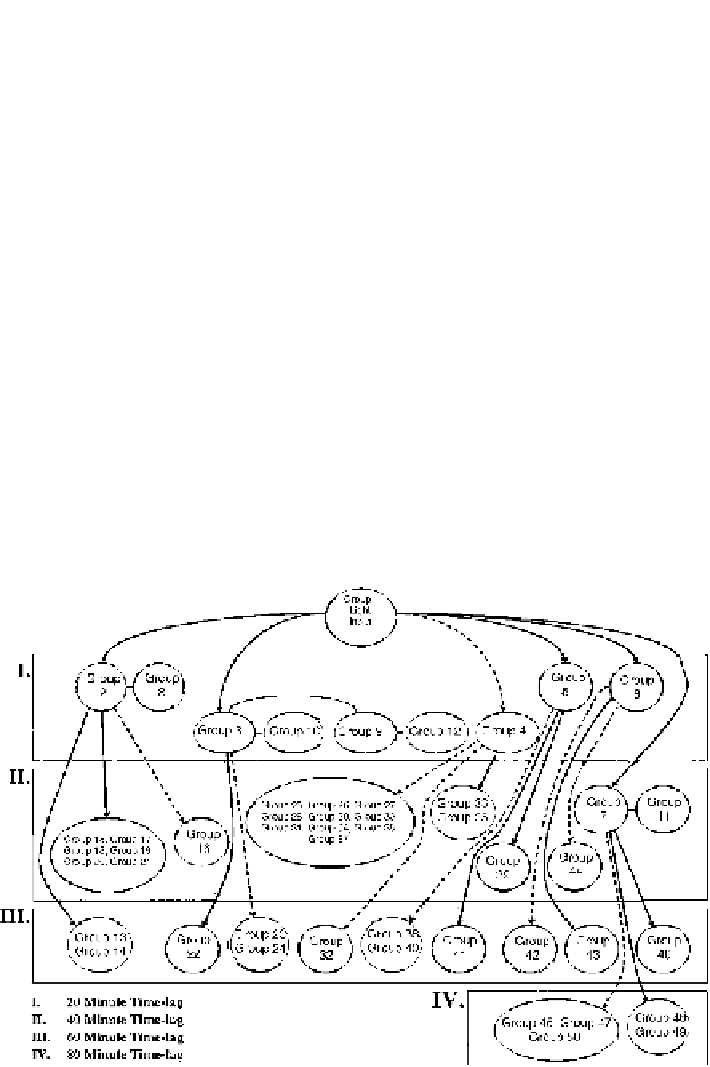
Figure
.
.
Simplified time-lagged correlation network across four time points; second iteration; where
,
−
and
−−
denote lagged correlation, lagged inverse correlation and zero-lagged correlation
between groups