Graphics Reference
In-Depth Information
Figure
.
.
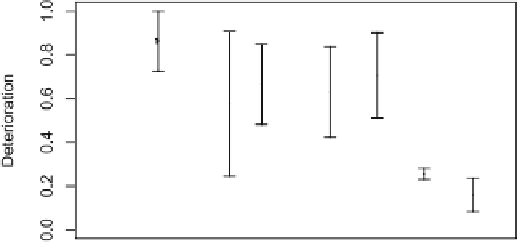
Average chemical deterioration and
% confidence intervals, measured at different time
points. here were either
or
measurements at each time point. Source: Confidential research data
Figure
.
.
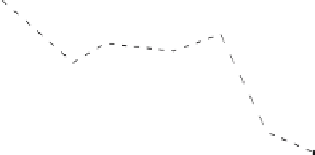
Union estimates (in thousands) of the protester turnout in various French cities in the
spring of
plotted against police estimates (also in thousands). Source: Le Monde
.
.
Figure
.
.
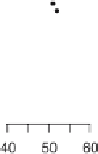
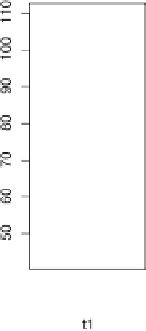
hesameplotasFig.
.
,drawnwithdifferentaspectratios.Dataaretimesforrunnersfor
the last stage of a road race vs. their times for the first stage