Graphics Reference
In-Depth Information
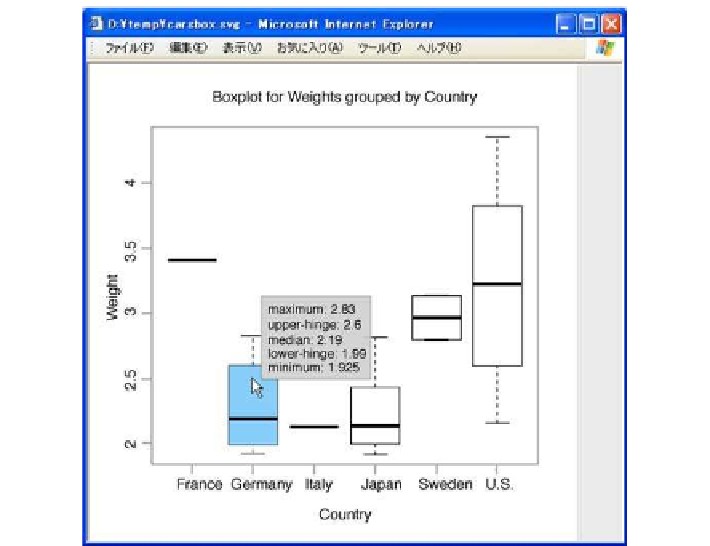
Figure
.
.
Boxplot obtained using the
iplot
function of the RInG library
lines running from the data point to both the x-andy-axes of the graph are also
displayed.
ihist
is a function that outputs the histogram in SVG form with interactive fea-
tures. For example, when the mouse cursoris positioned over a bar in the histogram,
information for this bar such as its upper and lower values, its class, and the num-
ber of observations included in it are displayed as a tooltip. he histogram shown in
Fig.
.
istheoutputofthecommand
ihist(rnorm(1000),breaks="FD")
.
iboxplot
is a function that outputs a boxplot in SVG form with interactive fea-
tures.Ifthe mousecursorispositioned overaboxintheboxplot,Tukey'sfive number
summary is displayed as a tooltip. In addition, the values of outlying data points are
displayed as tooltips when the mouse cursor is positioned over them.
Typing the following command yields a boxplot like that shown in Fig.
.
:
> iboxplot(split(Weight,Country),file="carsbox.svg",
xlab="Country", ylab="Weight",
main="Boxplot for Weights grouped by Country")
hese functions are available in server applications such as the “Okayama trade area
analysis system” described in the previous section. Figure
.
is an example of dy-
namic graphics. his dynamic functionality is implemented using the RInG library,
which can output the SVG code directly to the standard output as well as to a file.
herefore, an interactive plot that is dynamically generated without a temporary file
according tothe request of the user can beprovided through the Webusing a combi-