Graphics Reference
In-Depth Information
Figure
.
.
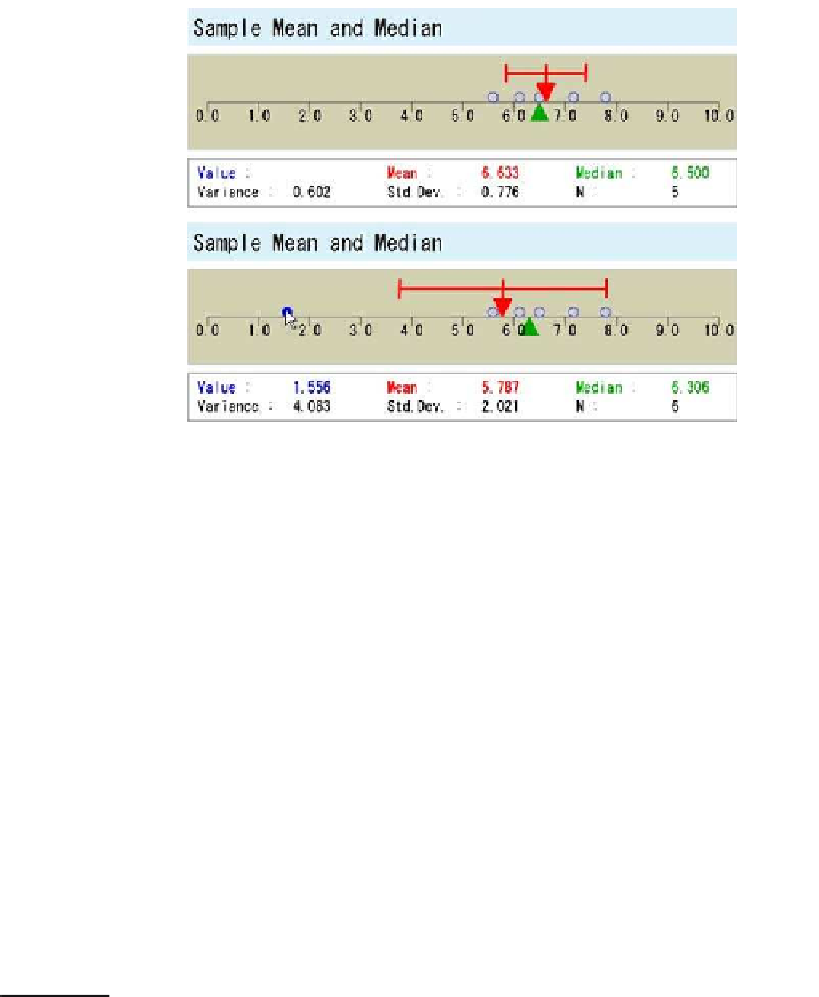
Teachware that illustrates the concepts of the mean and the median
Suchinteractive applications aredevelopedusing JavaorFlash,butitispossibleto
develop similar applications by utilizing the interactive characteristics of SVG. One
advantage of SVG teachware is that it is possible to use the interactive teachware
without a network connection or statistical engine.
he application introduced here is an SVG version of teachware developed in Java
for the Case project (Project CASE,
). his application was written to teach
the difference between the concepts of the mean and the median. he application
presents a coordinate axis. When a point on the axis is clicked, this data point is
added to the axis, and the mean and median of all data points are calculated and
presented. his application therefore shows the difference between the mean and the
median visually.
In Fig.
.
, the plot at the top shows five data points and displays the mean and
the median as triangles. he plot below shows that adding a data point that is much
less than the others changes the mean alot, but changes the median only slightly. Itis
easy to edit this SVG application, since the SVG is in a text file. If someone wanted to
change the language presented by the applications, they would only need to change
the corresponding parts; a special authoring tool would not be needed.
Application to Three-Dimensional Representations
18.5.2
By rearranging a X
D scatter plot, it is possible to generate a new graphical repre-
sentation. Figure
.
shows the results of a principal components analysis (PCA),
including the first three principal components, of the Cities data, colored according
to k-means clustering for six clusters.Figure
.
shows a prototypeof a
Ddendro-
gram.