Graphics Reference
In-Depth Information
Basic Objects
Objects that construct a X
D world are described within the
<Shape>
node. he
basic nodes for figures are
<Box>
,
<Sphere>
,
<Cylinder>
and
<Cone>
,and
parameters (suchas size and radius) are specified using fields. he material of an ob-
ject is specified within the
<Appearance>
node using the
<Material>
node or
the texturenode.hecolor andthe degree of transparency of aobject isalso specified
withinthe
<Material>
nodeusingthe
diffuseColor
andthe
transparen-
cy
fields. he position of an object is specified by nesting with the
<transform>
nodeand setting the
translation
field. Whenusing the
<Text>
node,it is pos-
sible to show strings with the
string
field and set the font type and size with the
fontstyle
field.Whenusing the
<Billboard>
node,it ispossible toorient the
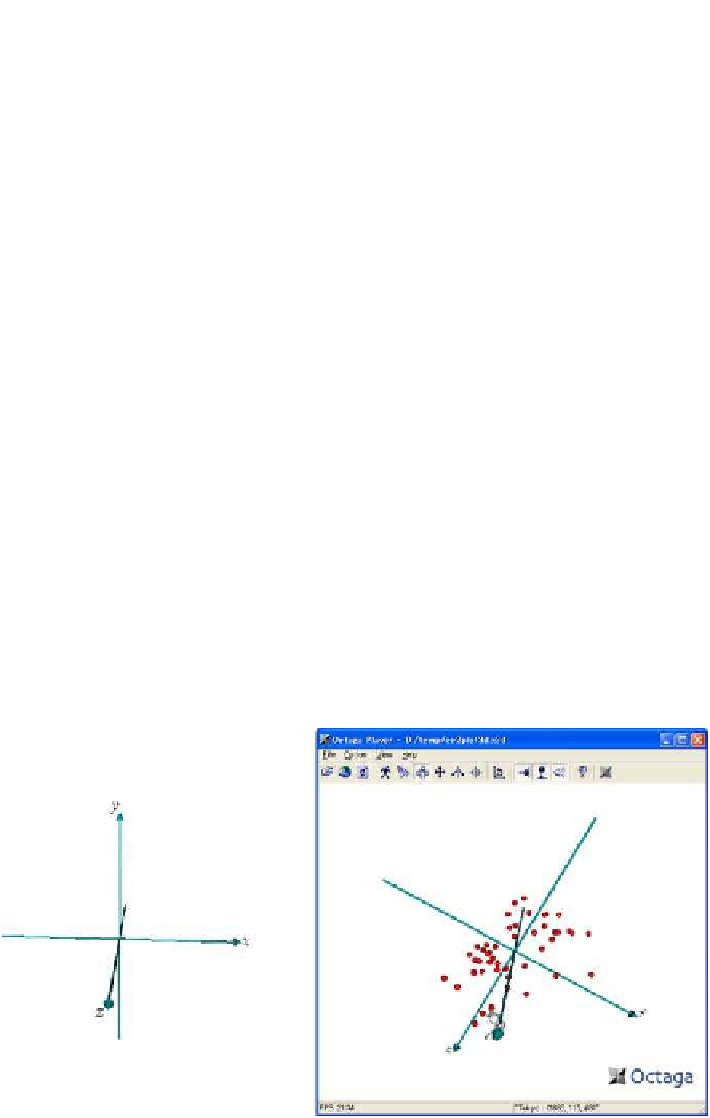
text face to the front view. Figure
.
, let, shows the coordinate axes generated by
using
<Cyllinder>
as the axis,
<Cone>
asthearrowsforthecoordinateaxes,
and
<Text>
astheaxislabels.ByarrangingpointsinthesamewayviaX
Dobjects
such like
Sphere
or
Box
, a scatter plot can be composed. he right-hand side of
Fig.
.
shows a
D scatter plot of the Cities data. his viewpoint gives almost the
same
D scatter plot as Fig.
.
.
Usingthe Octagaplayer,themodecanbesetbychoosing fromthefourthtoninth
buttons from the let of the tool bar. he modes are
Walk
,
Fly
,
Examine
,
Slide
,
Pan
and
Look-at
fromthelet.Various views canberealized usingthese modes.It
is possible to specify a mode that describes the
type
attribute of
<Navigation-
Info>
node. If a particular mode is specified, then all of the other mode buttons
that are not specified become disabled.
Moreover, it is possible to create a two-dimensional plane with
IndexFaceSet
and
IndexLineSet
.hus, a statistical map can be constructed using these nodes.
Figure
.
displays a
D bar chart of ward populations in the city of Sapporo (in
Figure
.
.
Coordinate axes (let) and
D scatter plot (right)