Graphics Reference
In-Depth Information
Figure
.
.
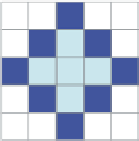
Vector and raster graphics
formation toredraw the image via sotware whenthe imageis expanded, reduced,or
transformed. In other words, the advantage of vector graphics over raster graphics is
that the degree of freedom is high for vector graphics with high-quality images. In
addition, vector graphics have the advantage that the file size relies on the quantity
of information in the diagram, and the size of the image is unrelated to the file size.
Implementation of Interactive Functionality and Animation
he sotware or plug-ins that display most XML graphics have functions that allow
actions similar to zooming and graphic movement. In addition, we can indepen-
dently add a new interactive function to the XML graphics, as written in JavaScript.
In addition, in SVG, we can change the attribute of an SVG element into SVG with
achange intime using Synchronized Multimedia Integration Language (SMIL,W
C
(
)),whichcanbebuiltontoSVG.hisisreferredtoasanimation.Wewillpresent
examples of the implementation of interactive functionality using JavaScript later.
Interactive Capabilities of XML Statistical Graphics
he following interactive functions are particularly required for statistical graphs in
exploratory data analysis (EDA), not only to visualize the data and the results from
the analysis, but also to support the interpretation of the graph:
zoom and pan (Fig.
.
)
tooltip, layer and highlight (Fig.
.
)
cooperation with other diagrams and tables (Fig.
.
)
Zoom and pan helps us to observe local properties of the original graphics. It is es-
pecially useful for visualizing datasets with large amounts of information, such as
scatter plots that include lots of data points and detailed map data. Figure
.
shows
a plot of the number of live births per
,
-year-old women in the United States
between
and
, and its smoothing curve, as realized by SVG. he right-hand
side of Fig.
.
shows a magnified view of part of the plot. Zoom and pan can be


