Graphics Reference
In-Depth Information
are oten standardized to all start at
. In Fig.
.
the cumulative times for all the
riderswhofinished the Tour de France cycle race in
are plotted. he data at the
endof each stage have been aligned at their means. heinterest lies inthe differences
in times between the riders, not so much in their absolute times.
Figure
.
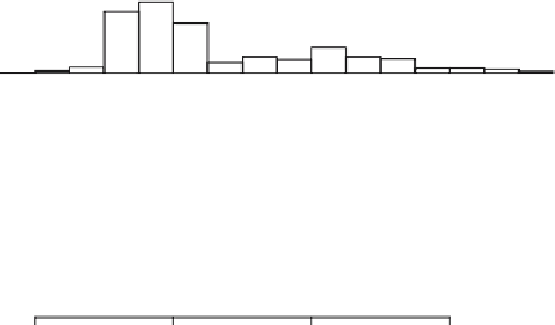
shows histograms for the Hidalgo stamp thickness data (Izenman and
Sommer,
).hefirstusesdefaultsettings andshowsaskewdistributionwithpos-
sibly a second mode around
.
. he second has rounded endpoints and a rounded
binwidth and shows stronger evidence for the second mode. he third is drawn so
thateachdistinctvalueisinadifferentbin(thedatawereallrecordedtoathousandth
of a millimetre). It suggests that the first mode is actually made of up to two groups
and that there may be evidence for several additional modes to the right. It also re-
vealsthatroundedvaluessuchas
.
,
.
,... ,
.
occurrelativelymorefrequently.
Izenman and Sommer used the third histogram in their paper. What the data repre-
Figure
.
.
hree different histograms of the Hidalgo stamp thickness data, all with the same
anchorpoint but with different binwidths. he horizontal scales are aligned and the total area of each
display is the same (note the different frequency scales). Source: Izenman and Sommer (
)