Graphics Reference
In-Depth Information
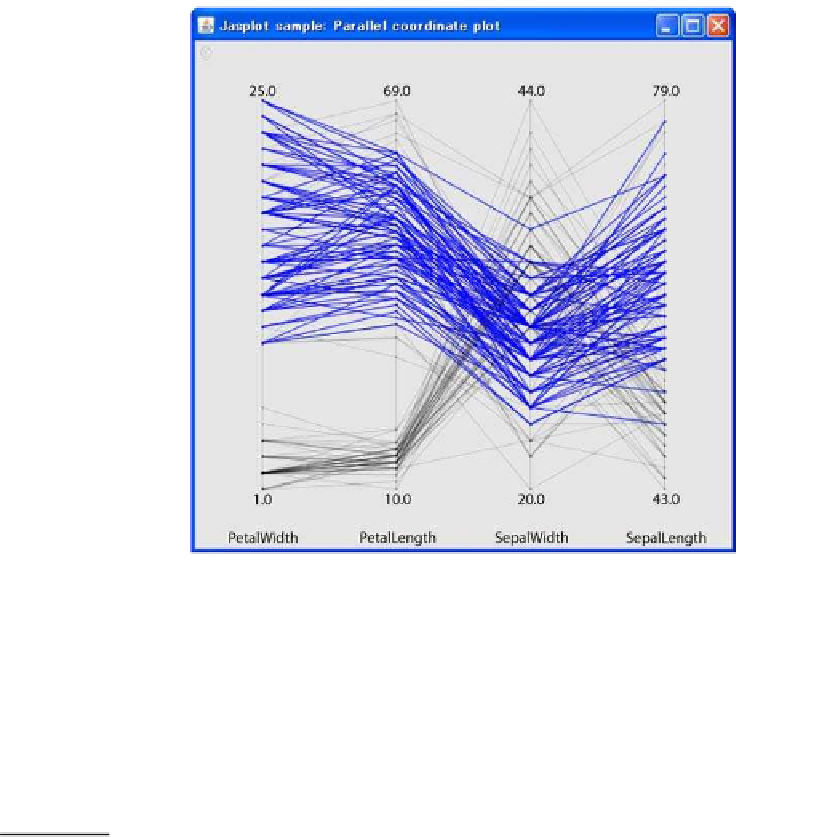
Figure
.
.
Parallel coordinate plot example
he program is not so different from the Java
D example above. We first create
a
DataModel
object. he real object is
CSVDataModel
that implements
Data-
Model
. hen we create a
PlotModel
object. Note again that the real object is
ScatterPlotModel
. We draw this object on the
JasplotPanel
object. Fi-
nally, weshowitina
JFrame
object.Wecanselectsomeobservations byarectangle
selector using mouse operations.
Classes for Original Data
17.3.3
Jasplotprovidesageneralmodelfordescribing statistical data by
DataModel
,from
which statistical graphics are drawn.
DataModel
is designed as an interface to fol-
lowthe principles of design patterns, andplays arole as amodelinthe MVC pattern.
DataModel
expresses a simple two-dimensional table whose rows and columns
represent observations and variables, respectively. We define basic methods for get-
tingthevaluesofdata(asrealvaluesandasstringvalues)andthesizesofobservations
and variables. Methods for getting the minimum, maximum and median of data val-
ues are declared. We also define a method to get a
PlotModelHandler
object,
which is used to record selection status for each observation.
RealDataModel
implements
DataModel
and handles data whose values are
allrealnumbers.he
setReal
method of this class sets real values from a given
two-dimensional array.