Graphics Reference
In-Depth Information
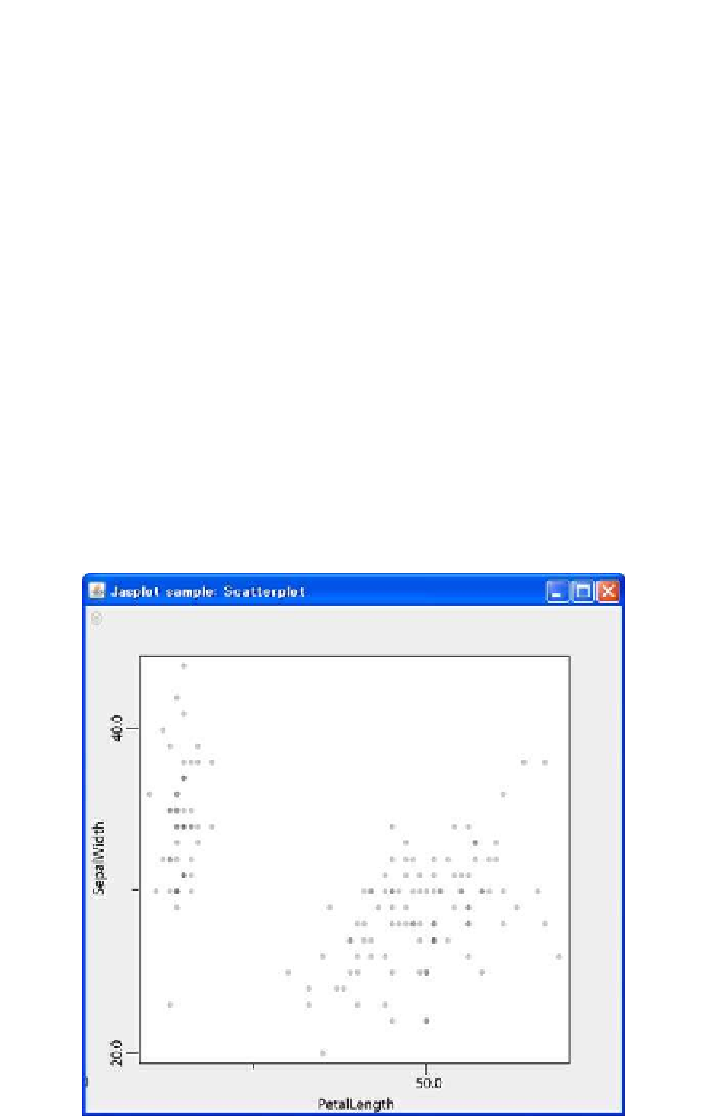
Jasplot has basic graphics classes such as scatterplots (Fig.
.
), histograms
(Fig.
.
) and boxplots (Fig.
.
). It implements scatterplot matrices (Fig.
.
) and
parallel coordinate plots (Fig.
.
) as examples of combining basic classes to build
new graphics. It also implements mosaicplots (Fig.
.
). hese graphics have func-
tions for focusing, zooming and linked views.
Jasplot was written by adopting the MVC design pattern. Each basic statistical
graphic is written as three main classes that implement the
DataModel
,
Plot-
Model
and
Plotter
interfaces.
DataModel
realizes the model of the MVC
pattern for a graphic. he view of the MVC pattern consists of
PlotModel
and
Plotter
. he controller of the MVC is realized by the
JasplotPanel
class, in
which graphics are drawn and mouse events are handled.
JasplotalsousesseveralGoFdesignpatternstorealizereusabilityandextensibility.
We illustrate them by building several new graphics such as scatterplot matrices or
parallel coordinate plots.
Jasplot realizes useful interactive operations. Jasplot has three different and ex-
changeable selectors for specifying particular observations. When the numbers of
data and variables are large, interactive operations can become slow. To reduce com-
putational burdens and to increase response speed, Jasplot adopts several mecha-
nisms such as control over repaint timing, multilayers and double buffering.
Figure
.
.
Scatterplot example