Graphics Reference
In-Depth Information
Figure
.
.
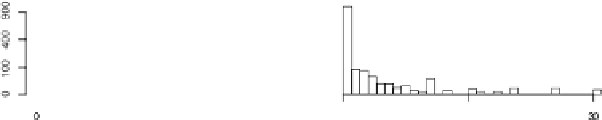
Histograms (with a square-root scale) of responses to “How many persons do you know
named Nicole?” and “How many Jaycees do you know?” constructed from the data and from random
simulations obtained for three fitted models: the Erdős-Renyi model (completely random links), our
null model (some people are more gregarious than others, but the propensities of people to form ties to
all groups are the same), and our overdispersed model (variation in gregariousness and variation in
propensities to form ties to different groups). Each model shows more dispersion than the one above,
with the overdispersed model fitting the data reasonably well. he propensities to form ties to Jaycees
show much more variation than the propensities to form ties to Nicoles, and hence the Jaycees counts
are much more overdispersed. (he data also show minor idiosyncrasies, such as small peaks at the
responses
,
,
, and
. All values that are greater than
have been truncated at
.) We use
square-root scales to make tail patterns clearer
AvalueofR that is close to
.
implies good chain mixing; if however R
.
for
some of the parameters, we allow the sampler to iterate some more. By using a scalar
summary rather than looking at trace plots, we are able to quickly assess the mixing
of all of the parameters in the model.
Distribution of Social Network Sizes
a
i
We now proceed to summarize the estimates of the
parameters a
i
.Atableof
numbers would be useless unless we want to find the numerical posterior estimates
foracertainpersoninthestudy;ourgoalisrathertovisualizetheposteriordistribu-
tion of the a
i
, so a histogram is a much more appropriate summary. It is interesting
to see how men and women differ in their perceived “gregariousness;” we therefore