Graphics Reference
In-Depth Information
Figure
.
.
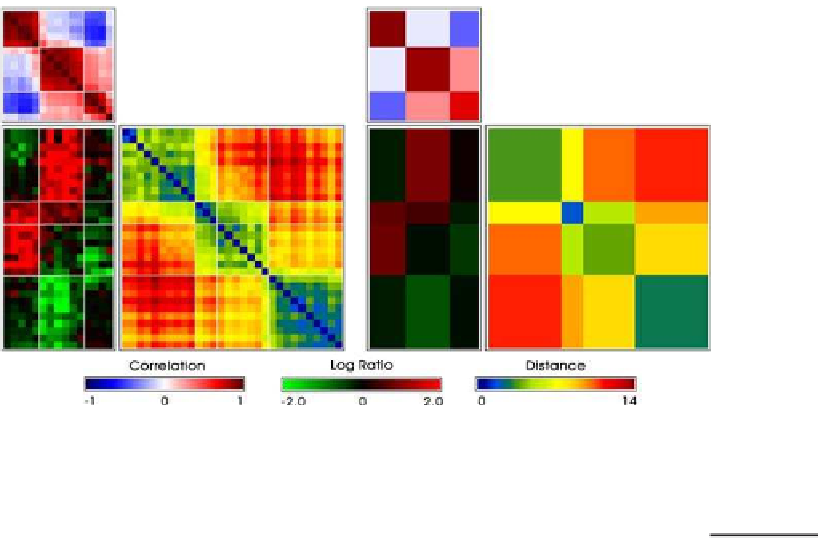
Let: partitioned data and proximity matrix maps for Dataset
. Right:su
cientdataand
proximity matrix maps
Sediment Display
15.4.2
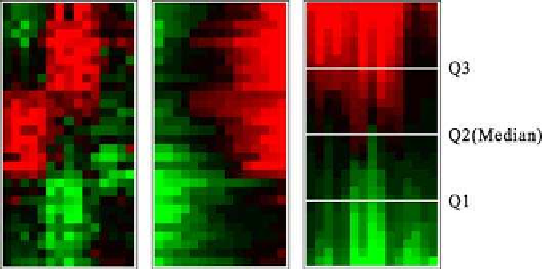
he sediment display of a row data matrix for rows (columns) is constructed by sort-
ingthecolumn(row)profilesforeachrow(column)independentlyaccordingtotheir
magnitudes. his display expresses the distribution structure for all rows (columns)
simultaneously. he middle panel of Fig.
.
hasthe sediment display for all
gene
expression profiles, while the right panel has the expression distributions for each
of the
selected arrays. he sediment displays for genes and arrays convey similar
information to that given by a boxplot when the color strips at the quartile positions
are extracted.
Figure
.
.
Sediment displays for genes (middle panel) and arrays (right panel) for the permuted data
matrix (let panel)ofDataset