Graphics Reference
In-Depth Information
Figure
.
.
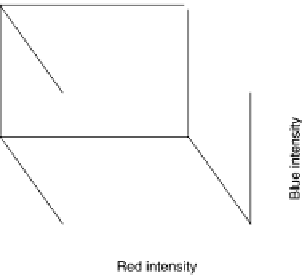
Relative (red, green, blue) hues in the RGB cubes for the four color spectra in Fig.
.
cepts and criteria for evaluating the performances of different seriation algorithms
in reordering related matrices below.
Relativity of a Statistical Graph
Chen (
) proposed a concept, the relativity of a statistical graph, for evaluating
general statistical graphic displays. he idea is to place similar (different) objects at
closer (more distant) positions in a statistical graph. In a continuous display, such as
thehistogram orascatterplot, relativity always holdsautomatically. hisisillustrated
by the histogram of the Petal Width variable and the scatterplot of the Petal Width
and Petal Length variables for
Iris flowers shown in Fig.
.
(Fisher,
). Two
flowers,denotedwith the
symbols, areplacednexttoeachotheronthesetwo
displays automatically, because they share similar petal widths and lengths. Friendly
and Kwan (
) proposed a similar concept to order information in general visual
displays,whichtheycalledtheeffect-ordereddata display.Hurley(
)alsostudied
related issues using examples involving scatterplot matrices and parallel coordinates
plots.
and