Graphics Reference
In-Depth Information
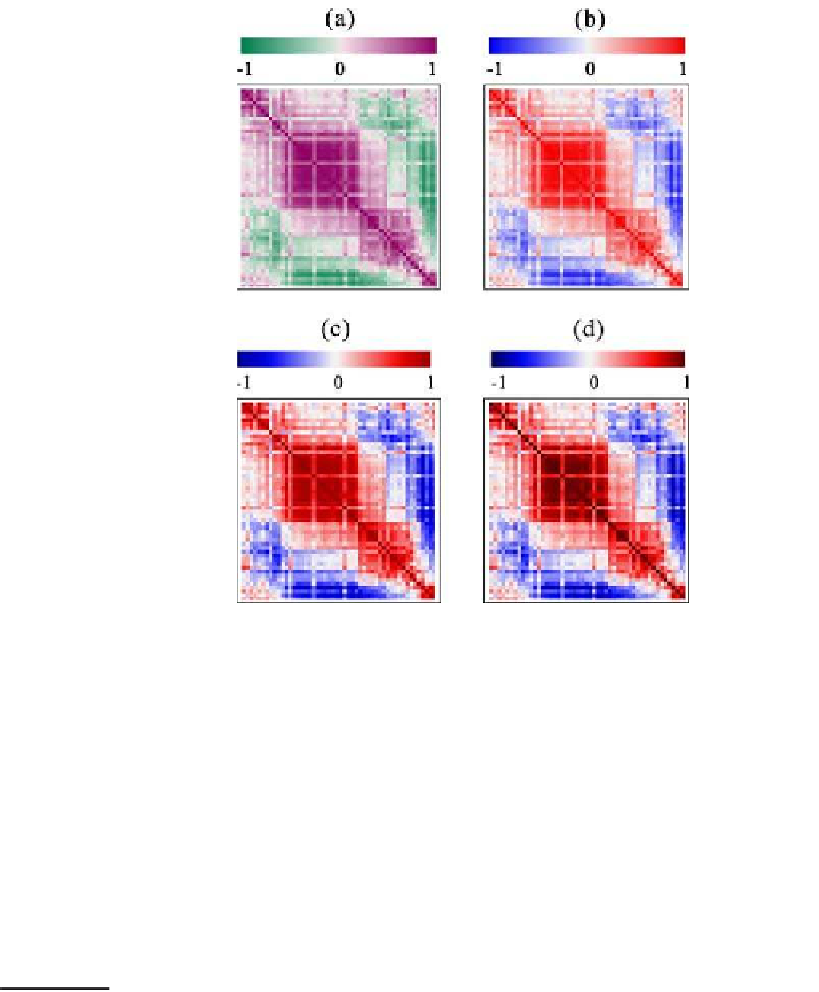
Figure
.
.
[his figure also appears in the color insert.] Four color spectra applied to the same
correlation matrix map for fity psychosis disorder variables (Chen,
)
Resolution of a Statistical Graph
Ifthedata matrix orproximitymatrices contain potential extremevalues,therelative
structure of these extreme values compared to the main data cloud will dominate
the overall visual perception of the raw data map and the proximity matrix maps.
his problem can be handled by using rank conditions or by compressing the color
spectrum to a suitable range. We can apply a logarithm or similar transformation to
reduce the outlier effect or to simply remove the outlier.
Seriation of Proximity Matrices
and the Raw Data Matrix
15.3.2
Without suitable permutations (orderings) of thevariables andsamples, matrix visu-
alizationisofnopracticaluseforvisuallyextractinginformation(Fig.
.
,letpanel).
Itisnecessary tocompute meaningful proximitymeasures forvariables andsamples,
and to apply suitable permutations to these matrices, before matrix visualization is
used to reveal the information structure of the given dataset. We discuss some con-