Graphics Reference
In-Depth Information
we can do trade-off analyses, discover sensitivities, understand the impact of con-
straints, and in some cases perform optimization using the model. For this purpose,
we shall use a dataset consisting of the outputs from various economic sectors and
other expenditures of a particular (and real) country. It consists of the monetary val-
ues over several years for the
Ag
ricultural,
Fi
shing, and
Mi
ning sector outputs, the
Man
ufacturing and
Con
struction industries, together with
Gov
ernment, miscella-
neous spending and resulting GNP; eight variables altogether. We will not address
the full ramifications of constructing a model from the data. Rather, we intend to
illustrate how
-coords can be used as a modeling tool. Using the least squares tech-
nique, we “fit” a function to this dataset and are not concerned at this stage about
whether the choice is “good” or not. he function obtained bounds a region in R
,
and is represented by the upper and lower curves shown in Fig.
.
.
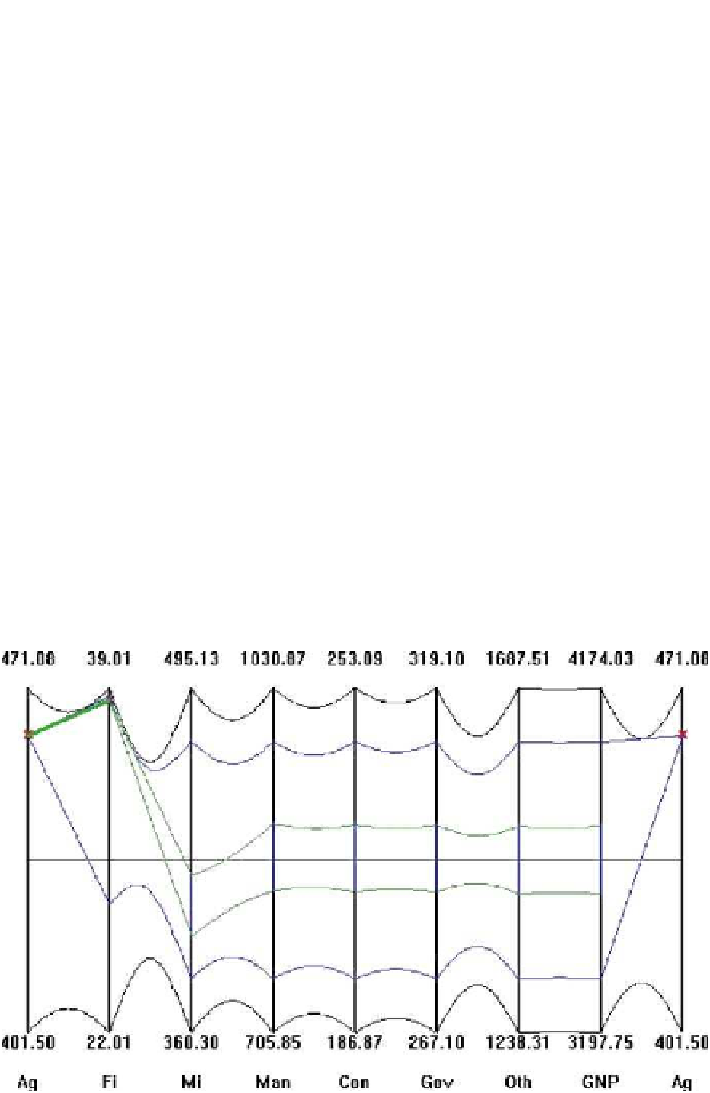
hepictureisineffectasimplevisual modelofthecountry's economy, incorporat-
ing its capabilities, limitations and interrelationships among the sectors, etc. A point
inside the region satisfies all of the constraints simultaneously, and therefore rep-
resents (i.e., the eight-tuple of values) a feasible economic policy for that country.
We can construct such points using the interior point algorithm. his can be done
interactively by sequentially choosing values of the variables, and we see the result
of one such choice in Fig.
.
. Once the value of the first variable is chosen (in
this case the agricultural output) within its range, the dimensionality of the region
is reduced by one. In fact, the upper and lower curves between the second and third
axescorrespondtotheresultingseven-dimensionalhypersurface,andshowtheavail-
Figure
.
.
Model of a country's economy: choosing high agricultural and high fishing output forces
low mining output