Graphics Reference
In-Depth Information
Figure
.
.
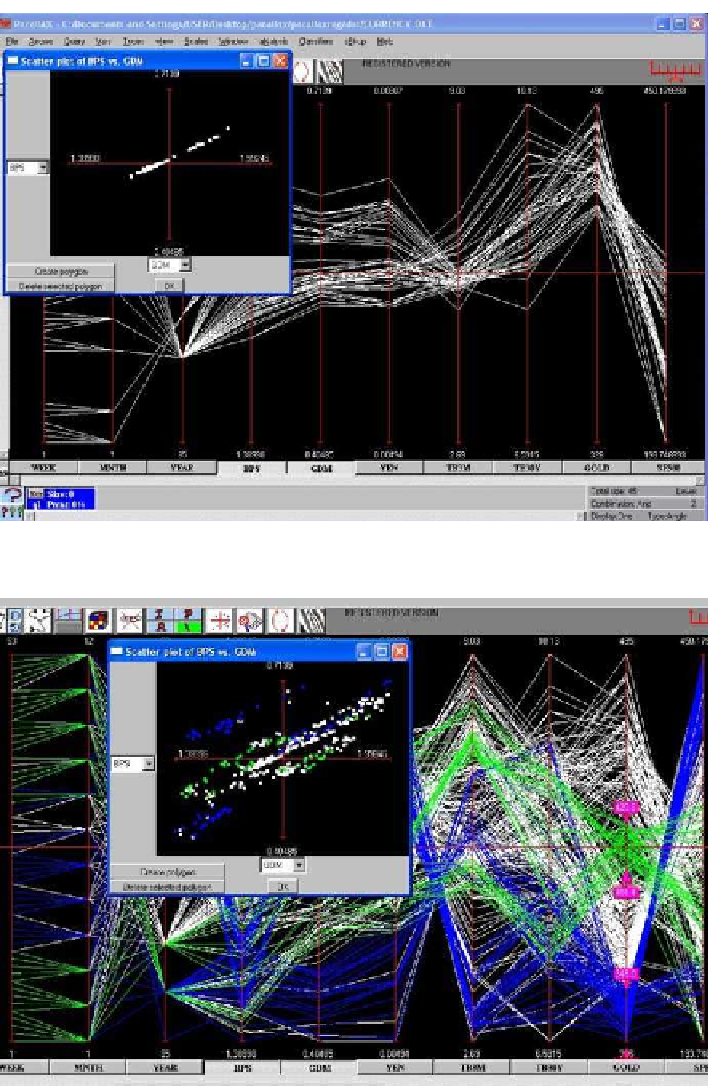
High
G
old. Note the perfect straight line in the
S
terling vs.
D
mark plot. he slope is the
rate of exchange between them, which remains constant when
G
old prices peak
Figure
.
.
[his figure also appears in the color insert.] Two price ranges for
G
old. he
S
terling vs.
D
mark plots for them show no regularity