Graphics Reference
In-Depth Information
Figure
.
.
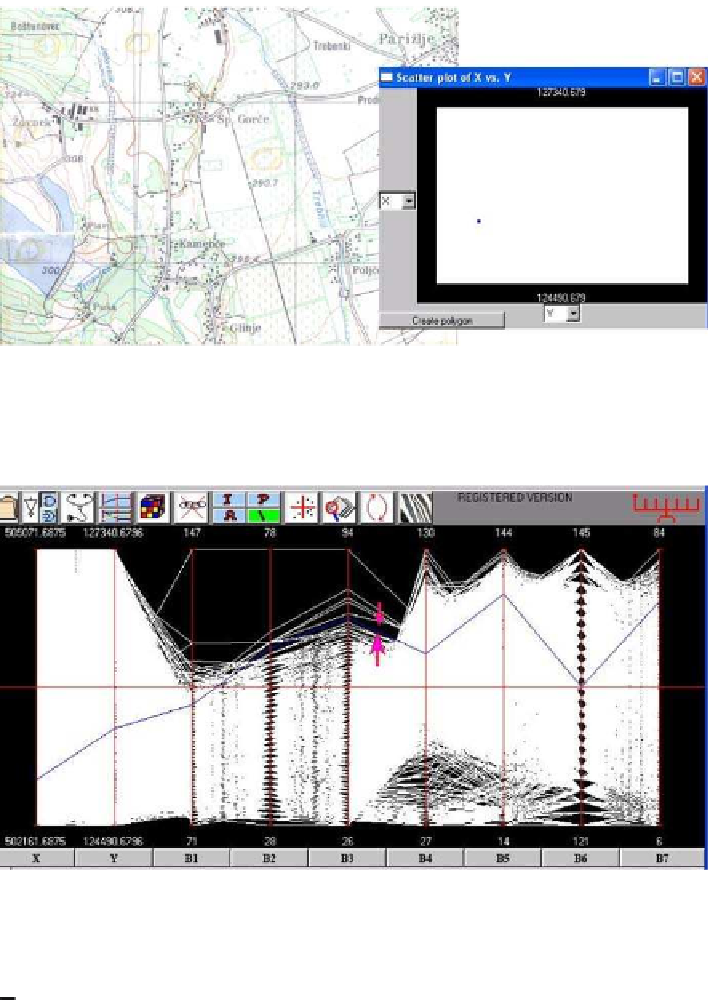
(Let) Region of Slovenia where seven types of ground emissions were measured by the
LandSat hematic Mapper, as shown in subsequent figures (thanks to Dr. Ana Tretjak and Dr. Niko
Schlamberger, Statistics O
ce of Slovenia). (Right) he display is the map's rectangular region, while
the dot marks the position where the seven-tuple shown in the next figure was measured
Figure
.
.
A query in Parallax showing a single data item: the X, Y position (as shown on the right of
Fig.
.
) and the values of the seven-tuple
(
B
, B
, B
, B
, B
, B
, B
)
at that point
Aside from starting the exploration without any bias, it is essential that you
understand the objectives.
Herethetaskistodetectandlocatevarious groundfeatures (i.e.,built-upareas, vege-
tation, water, etc.) on the map.here is a prominent lake in the lower-let corner that
has an unusual shape with an upward pointing “finger.” his brings us to the next
admonition: no matter how messy it looks,
carefully scrutinize the data display for clues and patterns.