Graphics Reference
In-Depth Information
Figure
.
.
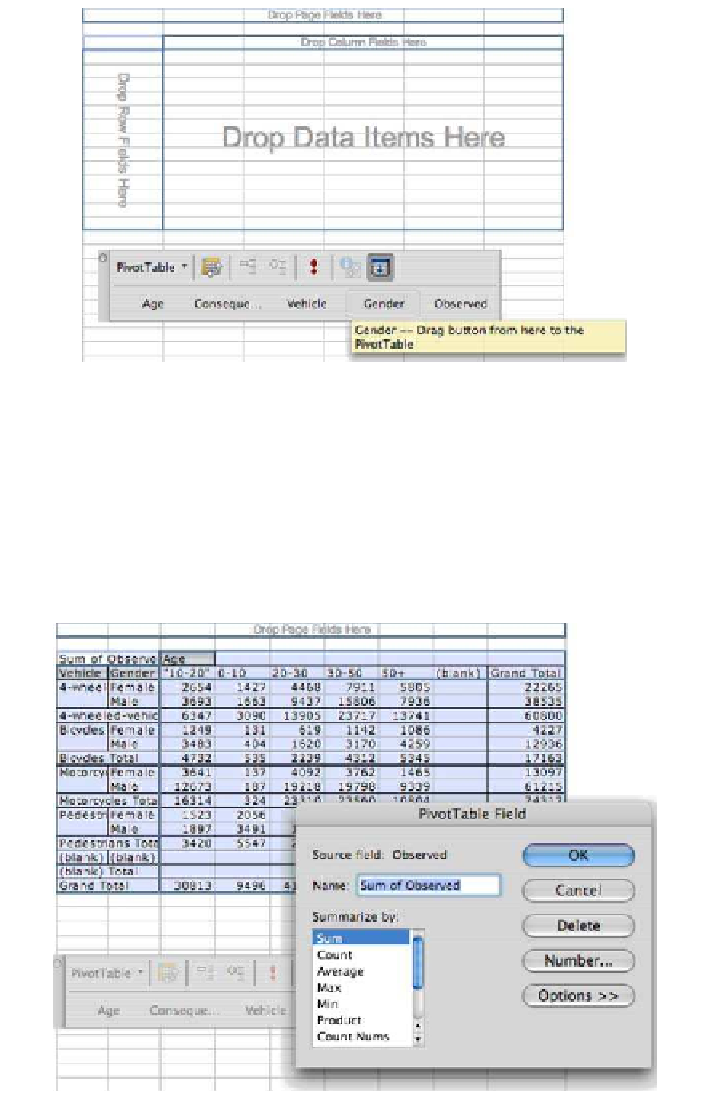
Excel's assistant for setting up a pivot table using drag and drop from a list of variables
rows and columns of a data table. Ater the variables of the frame have been set up,
the data variable is picked and placed in the middle of the data table.
he values of the data variable are summarized according to the combination
of the variables of the frame. Excel provides various options for summarizing (see
Fig.
.
): counting observations, summarizing their values, picking minima, max-
ima or averages, and so on.
Figure
.
.
Pivot table for the Accident Victims data. Front: dialog window showing the summarizing
options available for in Excel's pivot tables