Graphics Reference
In-Depth Information
Figure
.
.
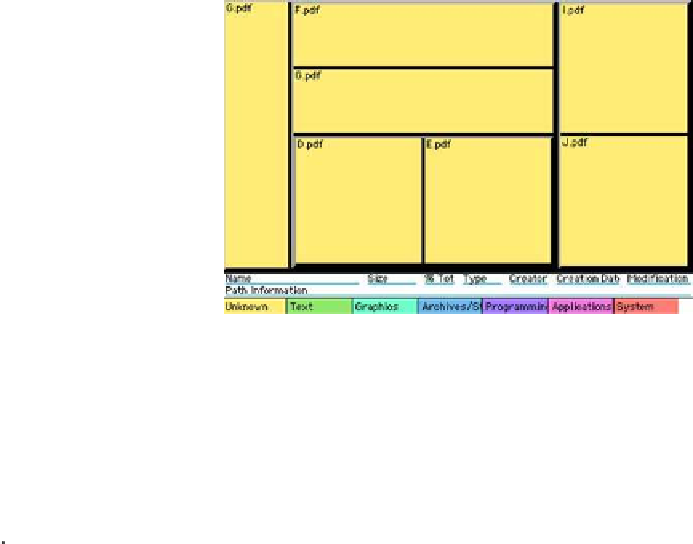
Tree (let) and accompanying treemap (right). In this example all nodes have equal weight.
Only leaves of the tree are visible as tiles; the other nodes determine the structure
Figure
.
.
Tree (let) and accompanying treemap (right). he tree shows a contingency table for the
Titanic data: the structure for the treemap on the right is gender
′
, class, survived
′
Treemaps and mosaicplots have a lot of features in common: both are area-based
plots; both plots share a strict hierarchical construction; both strongly depend on
the order of the variables. Treemaps have a richer structure than mosaicplots - any
contingency table canbewrittenintheformofatree,butnotviceversa (seeFig.
.
for example). When the tree shows a contingency table - all branches have the same
depth and all nodes at a specific level are split along the same variables - a treemap
simplifies to a mosaicplot. Both of the treemaps in Figs.
.
and
.
were created
using the TreeViz sotware (Johnson and Shneiderman,
).
Trellis Plots
13.4.2
Whileatreemap representsanextension tothebasic structureofamosaicplot, atrel-
lis plot (Becker et al.,
) uses the same basic structure but enables more flexible
displays. Trellis displays present the data in panels laid out in rows, columns and
pages. In each panel of the trellis, a subset of the data is plotted using an appropri-
ate display method, such as a barchart, a scatterplot, a dot plot, or a boxplot. Each