Graphics Reference
In-Depth Information
Figure
.
.
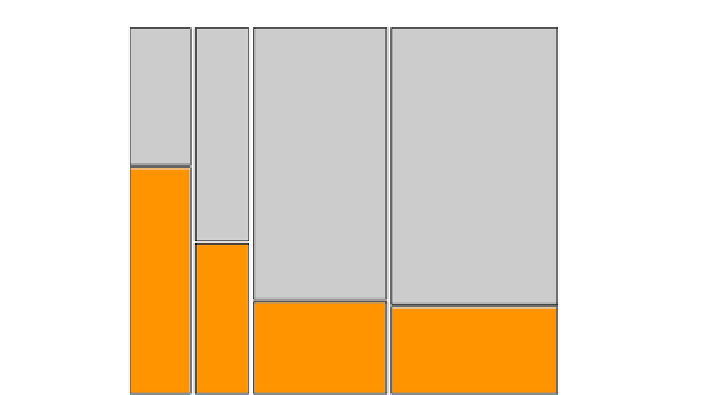
Two-dimensional mosaicplot of Class versus Survival. Each tile's width corresponds to the
probability of the associated class, while its height is the conditional probability of (Non-)Survival
For high-dimensional mosaicplots, the structure of the plot governs which of the
probabilities correspond to the heights and the widths of the tiles. However, the area
of a particular tile always corresponds to the joint probability of X
,...,X
p
.
Let v
be the set of variables among the first i variables that trigger splits in the
vertical direction. Similarly, let h
(
i
)
(
i
)
be the set of variables among the first i variables
that split horizontally.
Obviously,
.
Let X
(
i
)
be the ith variable in a mosaicplot. In the default construction by Hartigan
and Kleiner (
), v
=
v
(
)⊂
v
(
)⊂
v
(
)⊂ċċċ⊂
v
(
p
)
and v
(
p
)
h
(
p
)=
X
,...,X
p
(
i
)
consists of all variables with even indices that are less than i,
and h
(
i
)
contains all of the variables with odd indices:
v
(
i
)=
X
(
k
)
k
i
and h
(
i
)=
X
(
k
+)
k
+
i
For a doubledecker plot, the sets v
(
i
)
and h
(
i
)
can be written as:
v
(
i
)=
for all i
=
,...,p
−
and
v
p
X
(
p
)
(
)=
h
(
i
)=
X
()
,...,X
(
i
)
for all i
=
,...,p
−
and
h
(
p
)=
h
(
p
−
)
.
he width of each tile can then be interpreted as P
(
h
(
p
)
v
(
p
))
and its height is
P
(
v
(
p
)
h
(
p
))
.Atertheith split, the width of a tile is P
(
h
(
i
)
v
(
i
))
and its height
is P
(
v
(
i
)
h
(
i
))
.